As the month of August comes to a close, it’s a great time to review our monthly charts. When doing multiple timeframe analysis and looking for long-term trends, your monthly chart is your first stop for top down analysis. This month, we are noticing that July’s bullish bar has been engulfed by a bearish reversal, inside of a double top formation.
As we see here in the chart of the $QQQ, we have a Bearish engulfing bar, which signifies a major shift in trend in the near-term. It’s also significant that the $QQQ is showing this possible reversal formation, as it is the index that has led the current rally. The NASDAQ tech index is the index that has most AI stocks listed on it and recently, the market has been supported by the encouraging signs in the artificial intelligence space.
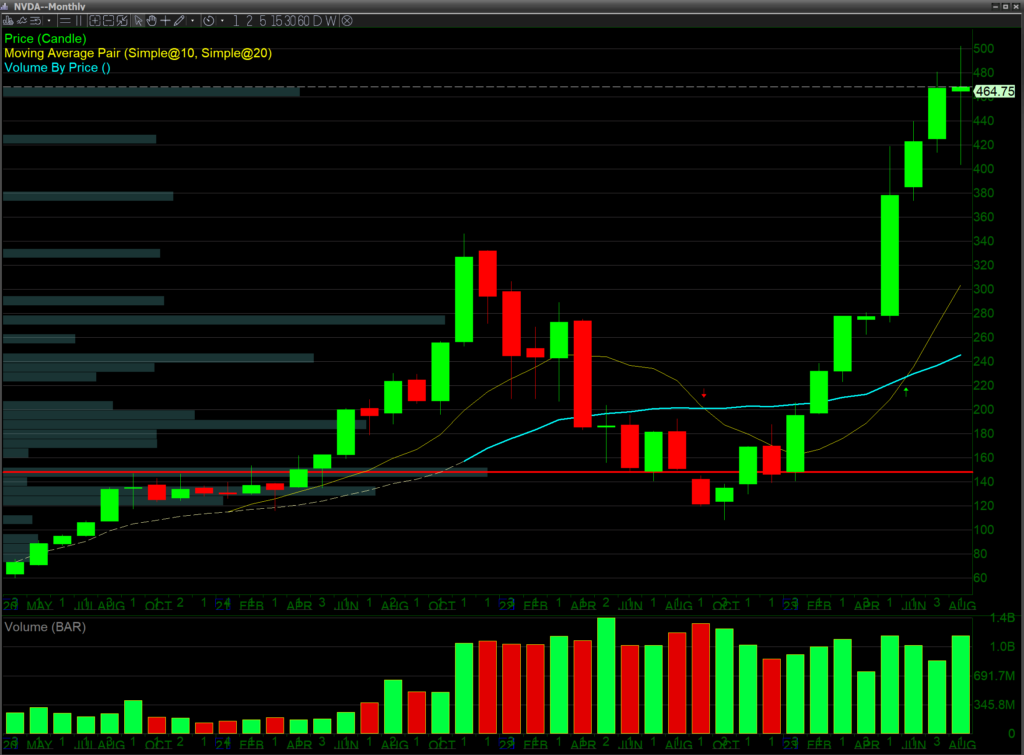
NVIDIA ($NVDA) reveals a parabolic chart pattern when viewed on its monthly time frame. Nvidia represents the best of AI and is the cornerstone stock of the recent AI rally. If this stock starts to reverse as its monthly chart indicates, it will soon lead the markets down; as $NVDA hype related to artificial intelligence is currently the only thing holding the tech sector up.
Let’s review this chain of analysis: the NASDAQ ETF ($QQQ) has a bearish engulfing bar on the monthly. Nvidia ($NVDA) is parabolic on the monthly. If Nvidia starts to reverse and drags down the NASDAQ, that reversal will start to lead the other major indexes to the downside. It’s best for traders to prepare for the worst as we enter September, and the markets return back to reality after the summer break.
Other than reviewing monthly charts, traders must consider other important factors such as the Federal Reserve, which has already indicated that inflation is higher than acceptable and they will resume raising interest rates. Markets have been responding, largely to fed speak and fed actions. This also lines up with the monthly chart analysis that was done above.
Last but certainly not least, oil prices are on the rise. This tends to be a catalyst for inflation as oil is required to transport all products to their final destination, making it the prime commodity. Oil prices are on the rise due to a cut in production by Saudi Arabia and other oil producing states. The cut in production was done in June and the effects are just now starting to reach the market. The price of oil is displayed in the chart below on the monthly.
As we wrap up the hot summer months, be prepared for the market to heat up in terms of volatility. So far 2023 has been fairly bullish but at least from our monthly analysis, be prepared for things to shift to a more bearish direction as we approach the end of the year.
Written by Michael DiGioia, Director of Education
Mike is available for One-on-One Coaching. Learn More


