Market Analysis
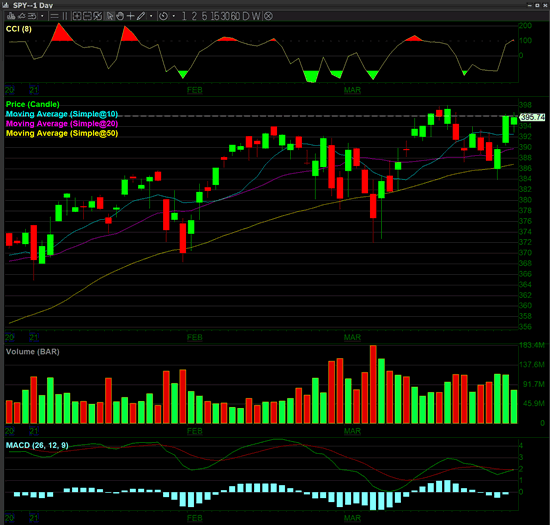
Recently, market behavior has been exactly as we have expected it to be; wild and whipsawing. This is very typical market behavior at the end of a mature up trend. In technical analysis we call this ‘stage 3’ of the market cycle. Please see our recent blog post to learn more about the 4 stages of market development. Be sure to keep an eye out for our next blog post coming next week regarding the 7 stock market events.
Stage 3 is controlled by emotional uncertainty. In Stage 2, the uptrend is a period that is controlled by greed. When greed gets extreme, the fear of lost profits increases as well as envy of missed profits. Shift in human emotions starts to cause the markets to change the type of movements it makes towards uncertainty. This can be seen on the chart below.
Our Featured Indicator of the Month: The Commodity Channel Index (CCI)
How do traders use the Commodity Channel Index (CCI) to trade stock trends?
Investopedia states that “the CCI was developed by Donald Lambert, a technical analyst who originally published the indicator in Commodities magazine (now Futures magazine) in 1980. Despite its name, the CCI can be used in any market and is not just for commodities.”
CCI is calculated with the following formula:
(Typical Price – Simple Moving Average) / (0.015 x Mean Deviation) ^3
It’s also noted that “the CCI was originally developed to spot long-term trend changes, but has been adapted by traders for use on all markets or timeframes. Trading with multiple timeframes provides more buy or sell signals for active traders. Traders often use the CCI on the longer-term chart to establish the dominant trend and on the shorter-term chart to isolate pullbacks and generate trade signals.” (Investopedia)
Why it is an important indicator is that “the CCI is a market indicator used to track market movements that may indicate buying or selling. The CCI compares current price to average price over a specific time period.
Different strategies can use the CCI in different ways, including using it across multiple timeframes to establish dominant trends, pullbacks, or entry points into that trend.” (Mitchell, 2020)
The Dollar is Making a Come Back
There are a few factors currently at play in the market. The first factor being a strengthening in the U.S. dollar. We need to ask ourselves why the U.S. dollar is getting stronger? The United States has excellent access to the COVID-19 vaccines that are the most effective: $PFE (Pfizer), $MRNA (Moderna), and $JNJ (Johnson and Johnson). The United States has also been very effective in getting its population vaccinated with about 29.4% of the population having at least one dose (CDC COVID Data Tracker 2021). Coronavirus numbers have been dropping significantly over the last month and only now have they started to increase as most of the country has now reopened. In much of the rest of the world, specifically Europe, there are still lock downs and most are in the middle of a third wave. Their populations are largely unvaccinated. As a result, the U.S. dollar is getting stronger. This will affect the stock market negatively as the markets are denominated in dollars and many U.S. international companies earnings are now being negatively affected by lockdowns all over the world.
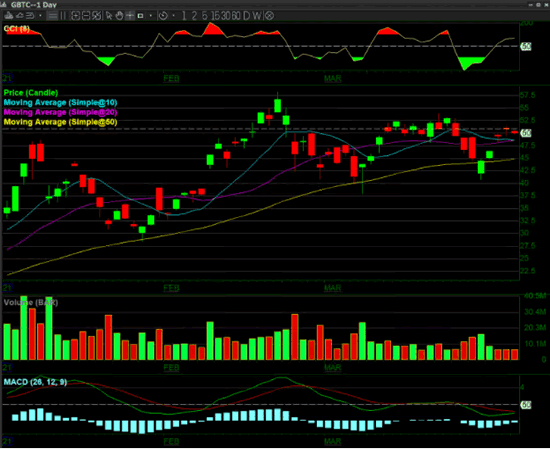
Crypto currencies and digital assets continue to gain strength, as more financial institutions begin to allow their customers to hold some investments in these digital assets. This can be seen in the $GBTC chart below.
What we are seeing is that digital assets are still gaining strength even though the U.S. dollar is getting stronger.
We are also now getting ready to start another earnings season. This will be the first quarter results for the new year 2021. The U.S. economy is largely recovered from the Coronavirus pandemic and it is probable that the extra stimulus will also further inflate the U.S. markets.
Trade well and Good Luck to those competing in the #1 Best Trader Competition!
References
CDC COVID Data Tracker. (2021, March 31). Retrieved March 31, 2021, from https://covid.cdc.gov/covid-data-tracker/#vaccinations
Mitchell, C. (2020, November 09). How Traders use CCI (Commodity Channel Index)
https://www.investopedia.com/articles/active-trading/031914/how-traders-can-utilize-cci-commodity-channel-index-trade-stock-trends.asp
Market Research and Analysis provided by Michael DiGioia, Director of Educational Services
What’s New from DAS
Improvements & Bug Fixes
We released two new production versions during the month of March: 5.6.4.8 and 5.6.4.9. Both versions include an extensive list of updates and bug fixes to the DAS Trader Pro platform.
Improvements/Features
-Added service fee reminder (if any) when placing short locate.
-Improved performance of Montage and Imbalance windows.
-Added “Equity percentage limitation per position” to account ctrl.
-Added “Position liquidation percentage” to account ctrl.
-Added “Curr Eqt Warn” (Current Equity Warning) to Risk Management window for warning if account’s current equity is less than this value.
-Added AlwaysOnTop hotkey.
-Added ToggleCrosshair hotkey.
-Added hotkey TrendLineToGlobalTF.
-Added Global Trendline Management dialog.
Bug Fixes
-CMDAPI bug fix – only send 1st timesale when receive multi-timesales at the same time.
-Bug fix – Montage Bid disappeared when “Less Flicker” was checked
-Bug fix – rectangle shape interior fill not drawing correctly.
-Bug fix – Price Oscillator study can’t save Histogram checkbox status.
-Fixed NYSE Tape crash.
-Bug fix – ichimoku cloud can’t draw on white chart background.
We highly recommend that you review the release notes here.
Please be sure to install the latest version of the DAS Trader Pro platform. You can do this very easily from DAS by clicking Tools > Auto Upgrade. You can learn more about the Auto Upgrade feature in our Knowledge Base.
Watch our Streams on YouTube
You can view the most recent live stream here as well as all of our live streams from this link.
If you have any ideas for anything you want to see on our live stream, please send us an email: newsletter@dastrader.com.


