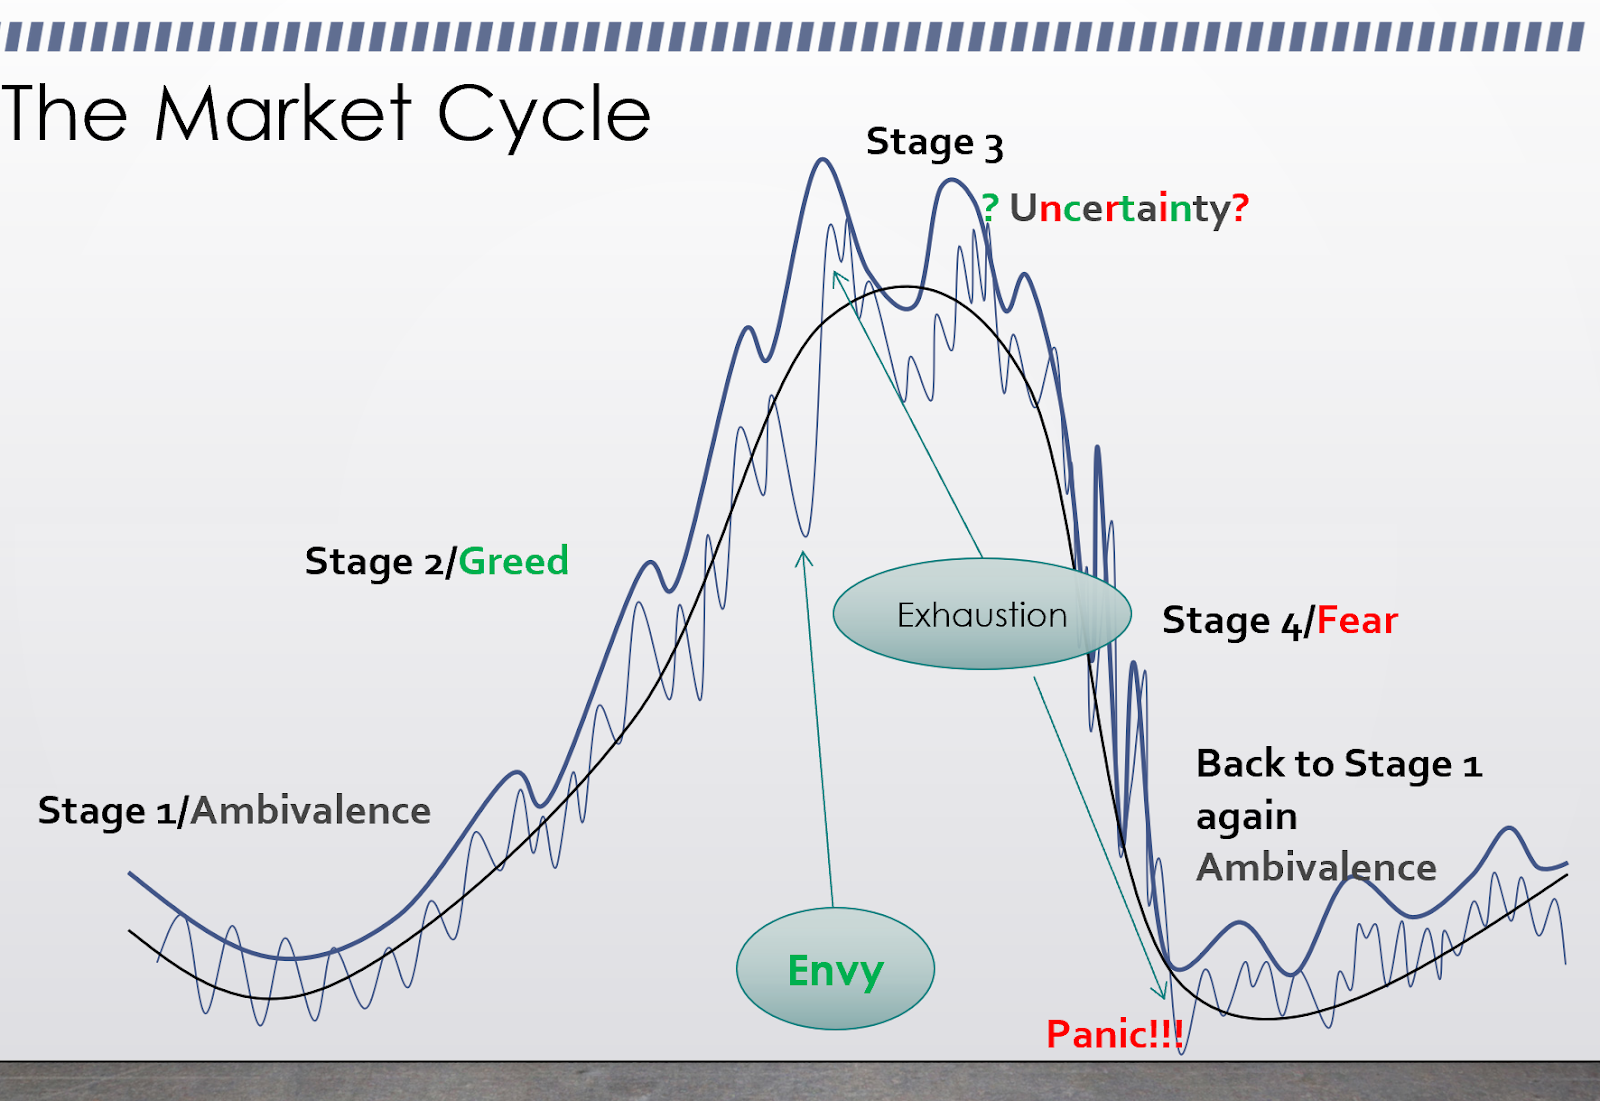
We’re going to touch upon the market cycle today, but be on the lookout for a full lesson on the four stages of market development. There are seven market events which we will touch upon in future blogs. Here we will cover the four stages that make up the entire cycle of the market.
Looking at the diagram above, you’ll see the entire market cycle made up of its 4 stages. Stage 1 is a boring and often uninteresting time of narrow ranged equal highs and lows. Stage 2 is a period of greed and is made of higher highs and higher lows. Stage 3 is a period of volatile uncertainty, made up of erratic but relatively equal highs and lows with steep drops and sharp rallies. Finally, Stage 4 is a period that is dominated by fear and is made up of lower highs and lower lows that finally ends in a capitulation and returns us back to Stage 1. This point is generally noted as a boring market as most small market participants are out of the market and are either broke or trying to recuperate.
When does the trend that was your friend, end?
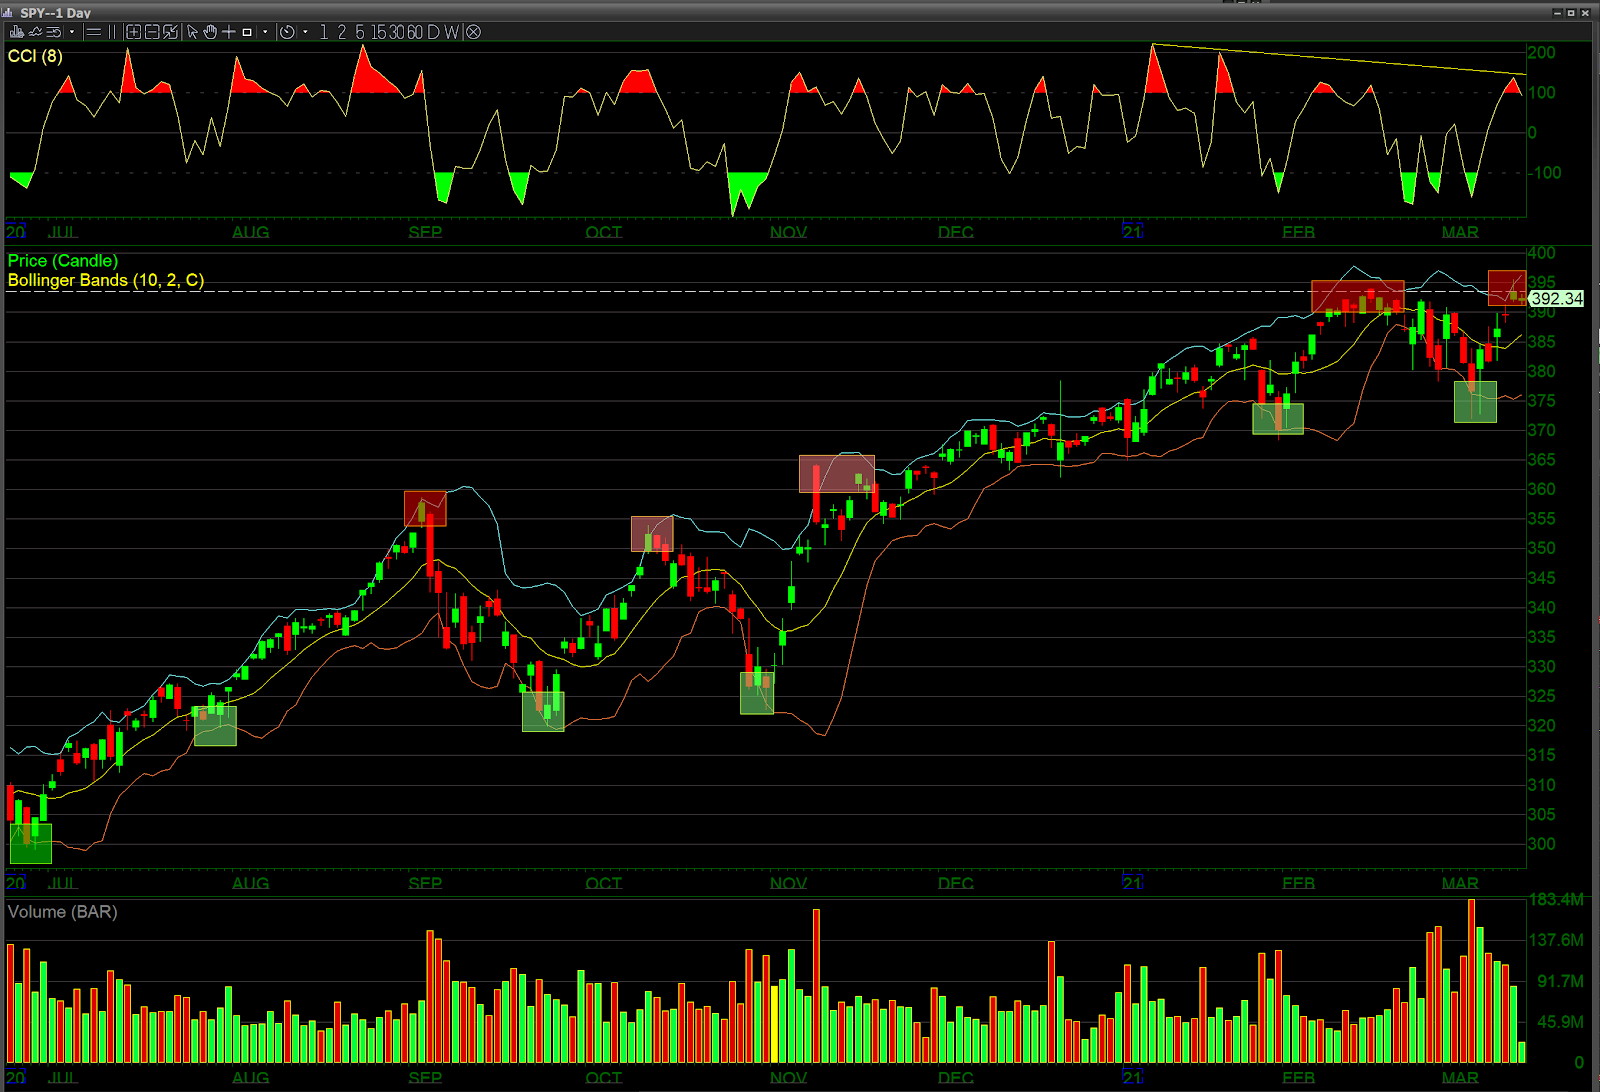
As traders we often hear “The trend is your friend”, but is there a way for us to gauge how long that’s going to last? Trends are like self-fulling prophecies; each time a pullback occurs and traders buy the dip it reinforces the strength of the trend. Some indicators help us gauge the strength of the tread and its possible reversal point. Usually in equity markets, trends last anywhere from 2 to 5 rotations. In commodities and FX, trends will last from 7 to 10 rotations. A rotation is another word for a pullback on a major timeframe. Let’s look and count the rotations on the post pandemic rally on the S&P 100 as shown on the $SPY.
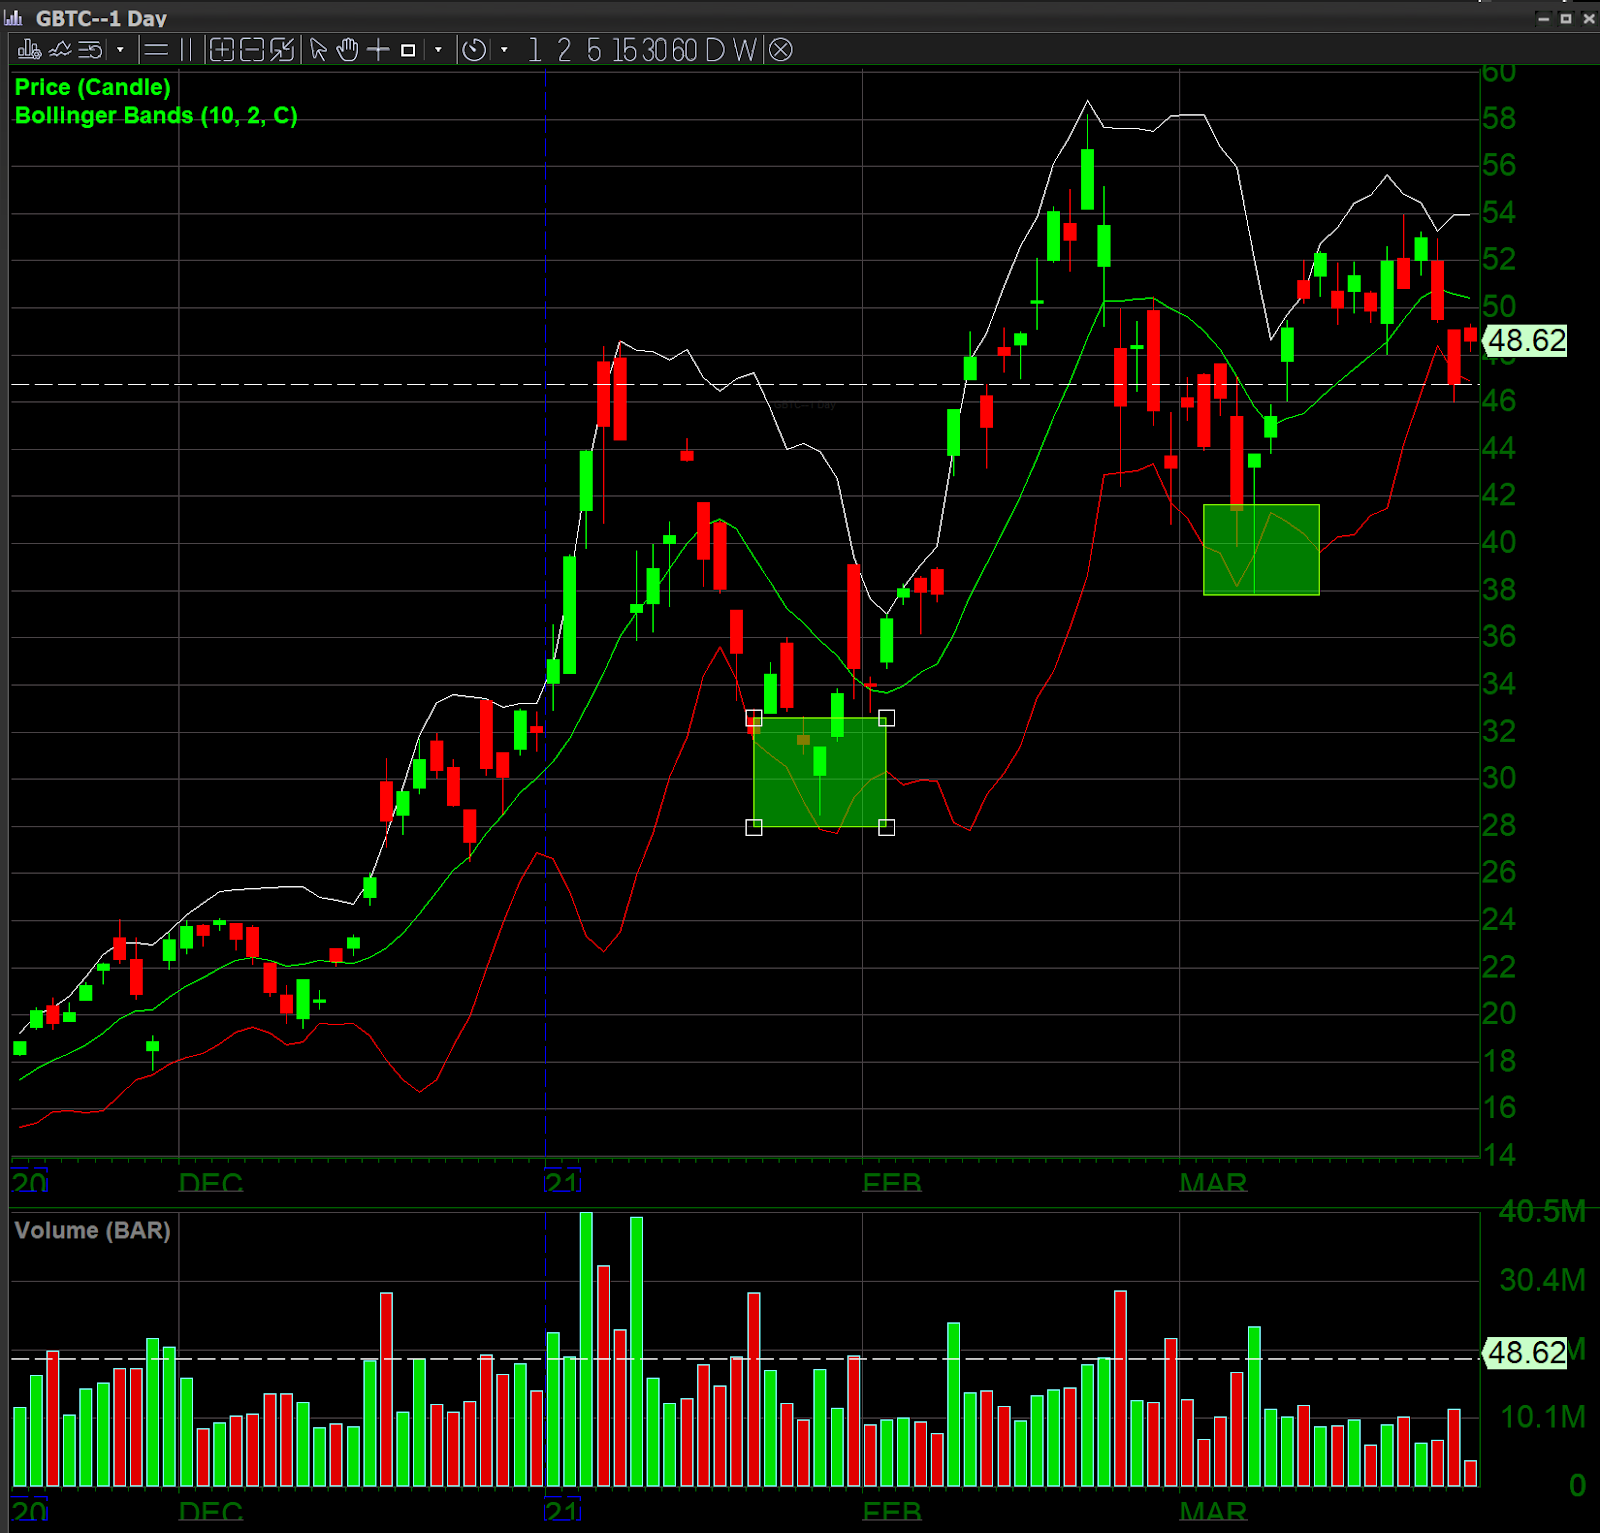
In our next example, we’re going to take a look at $GBTC, which represents bitcoin to see how far this could possibly go before this mature trend starts to falter and come to an end.
We’d like to point out the best rotations to trade (rotation is another word for pullback).
On equities they generally go for one through four rotations and one through nine rotations for FX, digital currencies and commodities.
What is the Envy Buy Setup?
The envy buy is when everybody is watching a particular issue go up higher and higher. For example, everybody watched Bitcoin break its prior high of 20,000 and then quickly run to 30,000. Many people sat on the sidelines watching it go higher as it ran to 40,000. At 45,000 many people stated they knew it was going to go higher but couldn’t buy at those levels. Finally it reached 57,000,then faltered and pulled back. This is when it pulled back to about 44,000 and the people who had watched it run from 20,000 up to 45,000 finally committed and bought it. Now it is significantly higher at 65,000. This is called the envy buy setup because traders were watching it run up, envious of those who were already in and then finally bought it on the first significant pull back from the newly established high.
The envy buy setup will often lead to a slightly higher high but that high will start faltering just after achieving a new high. This starts a new choppy and volatile phase dominated by uncertainty.
Our other featured technical indicator this month is The Bollinger Bands®. This is a technical analysis tool that is defined by a set of trendlines plotted two standard deviations (positively and negatively) away from a simple moving average (SMA) of a security’s price, but which can be adjusted to user preferences. Bollinger Bands® were developed and copyrighted by famous technical trader John Bollinger, designed to discover opportunities that give investors a higher probability of properly identifying when an asset is oversold or overbought. (Hayes, 2020)
We hope that this insight into the “Market Cycle” and Bollinger Bands was insightful. Always do your homework when it comes to the use of any indicator, and be sure to reach out to DAS Support for any questions related to the DAS Trader Pro platform.
Trade Well.
Reference
Hayes, A. (2020, August 28). Bollinger Band®. Retrieved March 24, 2021, from https://www.investopedia.com/terms/b/bollingerbands.asp
Written by Michael DiGioia, Director of Institutional Sales
Mike is available for One-on-One Coaching. Learn More