As the first month of 2022 comes to a close, our repeated calls for traders and investors to take profits and be cautious has become clear. The market is down approximately 10%, which makes this a much-needed correction. This is the worst market performance since 2008 for the start of the year.
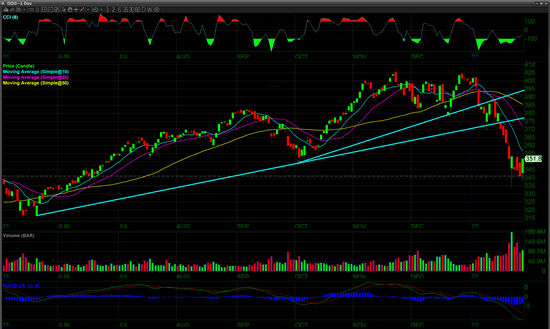
Trendline breaks on the $QQQ have led to a greater than 10% decline in the tech heavy index. Currently, the CCI is indicating that we are deeply oversold and ready for a short term relief rally; possibly a trend line break and fade.
We have been expecting this; let’s outline the underlying reasons for this correction. First, inflation has become a serious problem, not just for the markets but for the entire world. The Federal Reserve Bank’s primary function is to keep inflation in check where it should be maintained at or around 2%. However, in 2021 inflation raged out of control at 8%. This was largely due to excessive stimulus and Quantitative Easing by the Federal Reserve Bank. Another key factor was supply chain interruptions caused by the pandemic. This reduced the amount of supply in key products such as semiconductors. We have found ourselves in a scarce situation with an overstimulated market, consumers looking to spend their stimulus checks, and a lack of products due to supply chain interruptions.
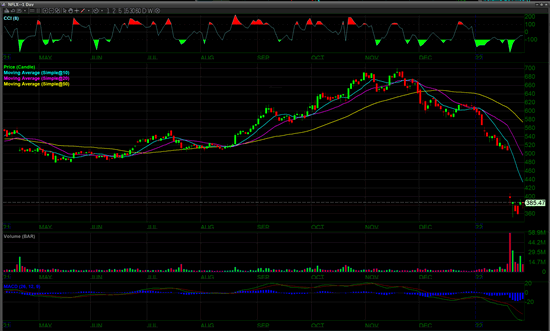
Next, we have companies reaching their pinnacle of earnings potential. Let’s review Netflix ($NFLX) as an example. Over the last two years, Netflix has experienced tremendous subscription growth with stay-at-home orders and people staying home to avoid the pandemic. Now, new subscriber levels have slowed. Markets are forward-looking, so investors would rather put their money somewhere else as they have already experienced most of the upside that they would ever expect to get from Netflix. This situation is the same for most of the stay-at-home digital stocks. Most of the stocks are listed on the Nasdaq-100 index as shown on the $QQQ. Much of the rally has been led by the $QQQ as it is the tech heavy index. Therefore, we would expect the $QQQ to sell off the worst in the correction as it has already done, and will continue to perform the worst as it initially led the rally.
The huge gap was caused by $NFLX earning results.
Another example of how earnings are falling short is in the banking sector. For example, Goldman Sachs ($GS), reported a drop in its trading revenue as the gains they made during the post pandemic stimulus driven rally have now trickled to a halt. Also, investment banking revenue has slowed down as tightness in the labor market has caused them to increase compensation and bonuses, driving up costs. Inflation has increased a lot of their costs, especially for infrastructure heavy banks like JP Morgan Chase ($JPM). We will continue to see this trend. Traditionally, banks would be expected to do well in a rising interest rate environment, but due to high rates of inflation and increasing labor costs we are not seeing it this earnings season.
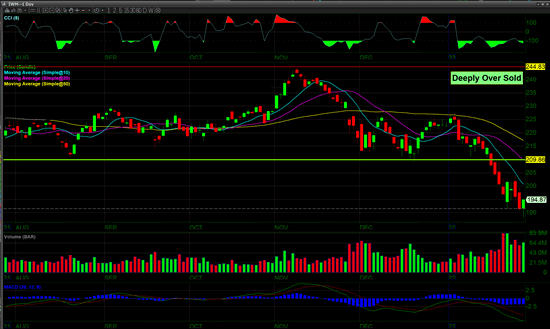 The Russell 2000 index the $IWM indicated the coming sell-off the best and we are using it as a guide for what is to come next for the markets. The Russell 2000 index has many small to midsize companies which are interest rate sensitive. These companies have heavy borrowing costs which are expected to increase as interest rates rise. They are also being affected by the increase in costs from inflation and experiencing shortages in labor and rising labor costs. Therefore, these companies are under the most pressure.
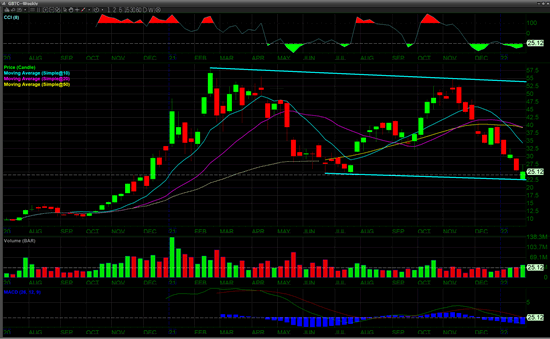
Digital assets are currently trading with the tech index: the Nasdaq-100 as represented by the $QQQ. We have seen a significant pullback in the price of Bitcoin, Ethereum, and all major digital assets. Looking at the chart of $GBTC, it looks like things are finally starting to bottom out. The strengthening of the U.S. dollar will also continue to negatively affect digital assets as they are denominated in U.S. dollars.
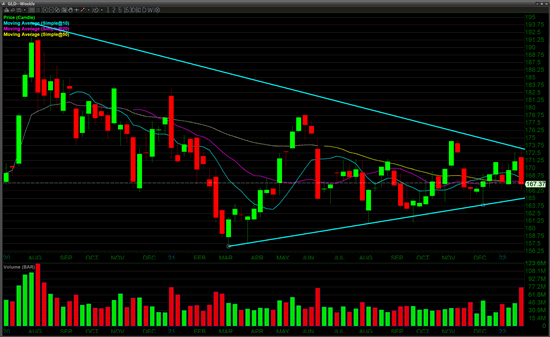
The strength in the U.S. dollar has also affected the price of gold and silver as they are the traditional hedge to the U.S. dollar. As you can see here in the chart of the $GLD, gold has been in a long term consolidation pattern. It is currently near the low of its range, but we would expect that it will move back up from these levels in the near future.
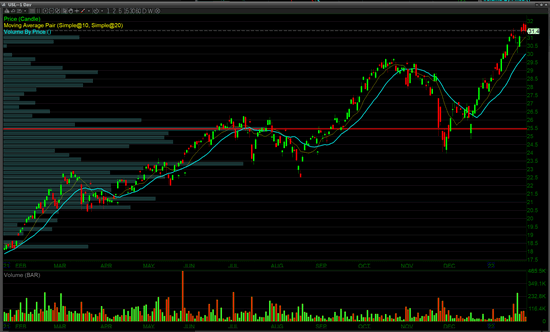
The oil ETF $USL is reaching multi month highs as oil prices have surged. $USL is the 12 month futures contract representing U.S. oil contracts.
Finally, we have geopolitical risk with Russia posturing to invade Ukraine. This would have a profound effect on the market, specifically the energy market as Russia is a substantial oil and natural gas producer. Looking at the chart of the $USL, there is potential for a major move towards $100 a barrel or more. This would drive up inflation even more as oil is the prime commodity needed to transport goods to their final destinations. Oil prices beyond $70 a barrel have a negative correlation to stock market prices. Prices beyond that would be even more devastating.
Trade well & stay cautious. Cash is king in a declining market.
What’s New from DAS
While we didn’t release any production updates or beta updates during the month of January, we did implement our new alert status page. Please be sure to bookmark this page to keep track of any outages or other issues with the DAS Trader Pro platform and network.
Please be sure to install the latest version of the DAS Trader Pro platform. You can do this very easily from DAS by clicking Tools > Auto Upgrade. You can learn more about the Auto Upgrade feature in our Knowledge Base.
Watch our Streams on YouTube
You can view the most recent DAS Trader Newsroom here as well as all of our newsrooms from this link. Also be sure to subscribe to our YouTube channel for educational and trading videos as well as all things DAS! And also be sure to follow us on all major social media platforms by following @dastrader.
If you have any ideas for anything you want to see on our live stream, please send us an email: newsletter@dastrader.com


