
Market correlations are never 100% predictable, but the following market correlations are highly predictable in normal times. Market correlations work until they don’t. When they don’t work, it’s called a divergence, and that’s a sign that something is changing. One divergence may be considered a red flag, but multiple divergences in various relationships are a strong signal that something is amiss with the overall system. This would be an indication of a possible recession coming or some other kind of infrequent anomaly.
The 80/20 Rule: Market correlations work 80% of the time and start to be divergent 20% of the time
An Inverse Relationship: Market correlations move in opposite directions from each other. Usually one is leading and the other is lagging. Traders and investors must learn to follow the leading indicator.
A Direct Relationship: The price of one security goes up when the price of another security goes up, meaning they move in tandem with each other.
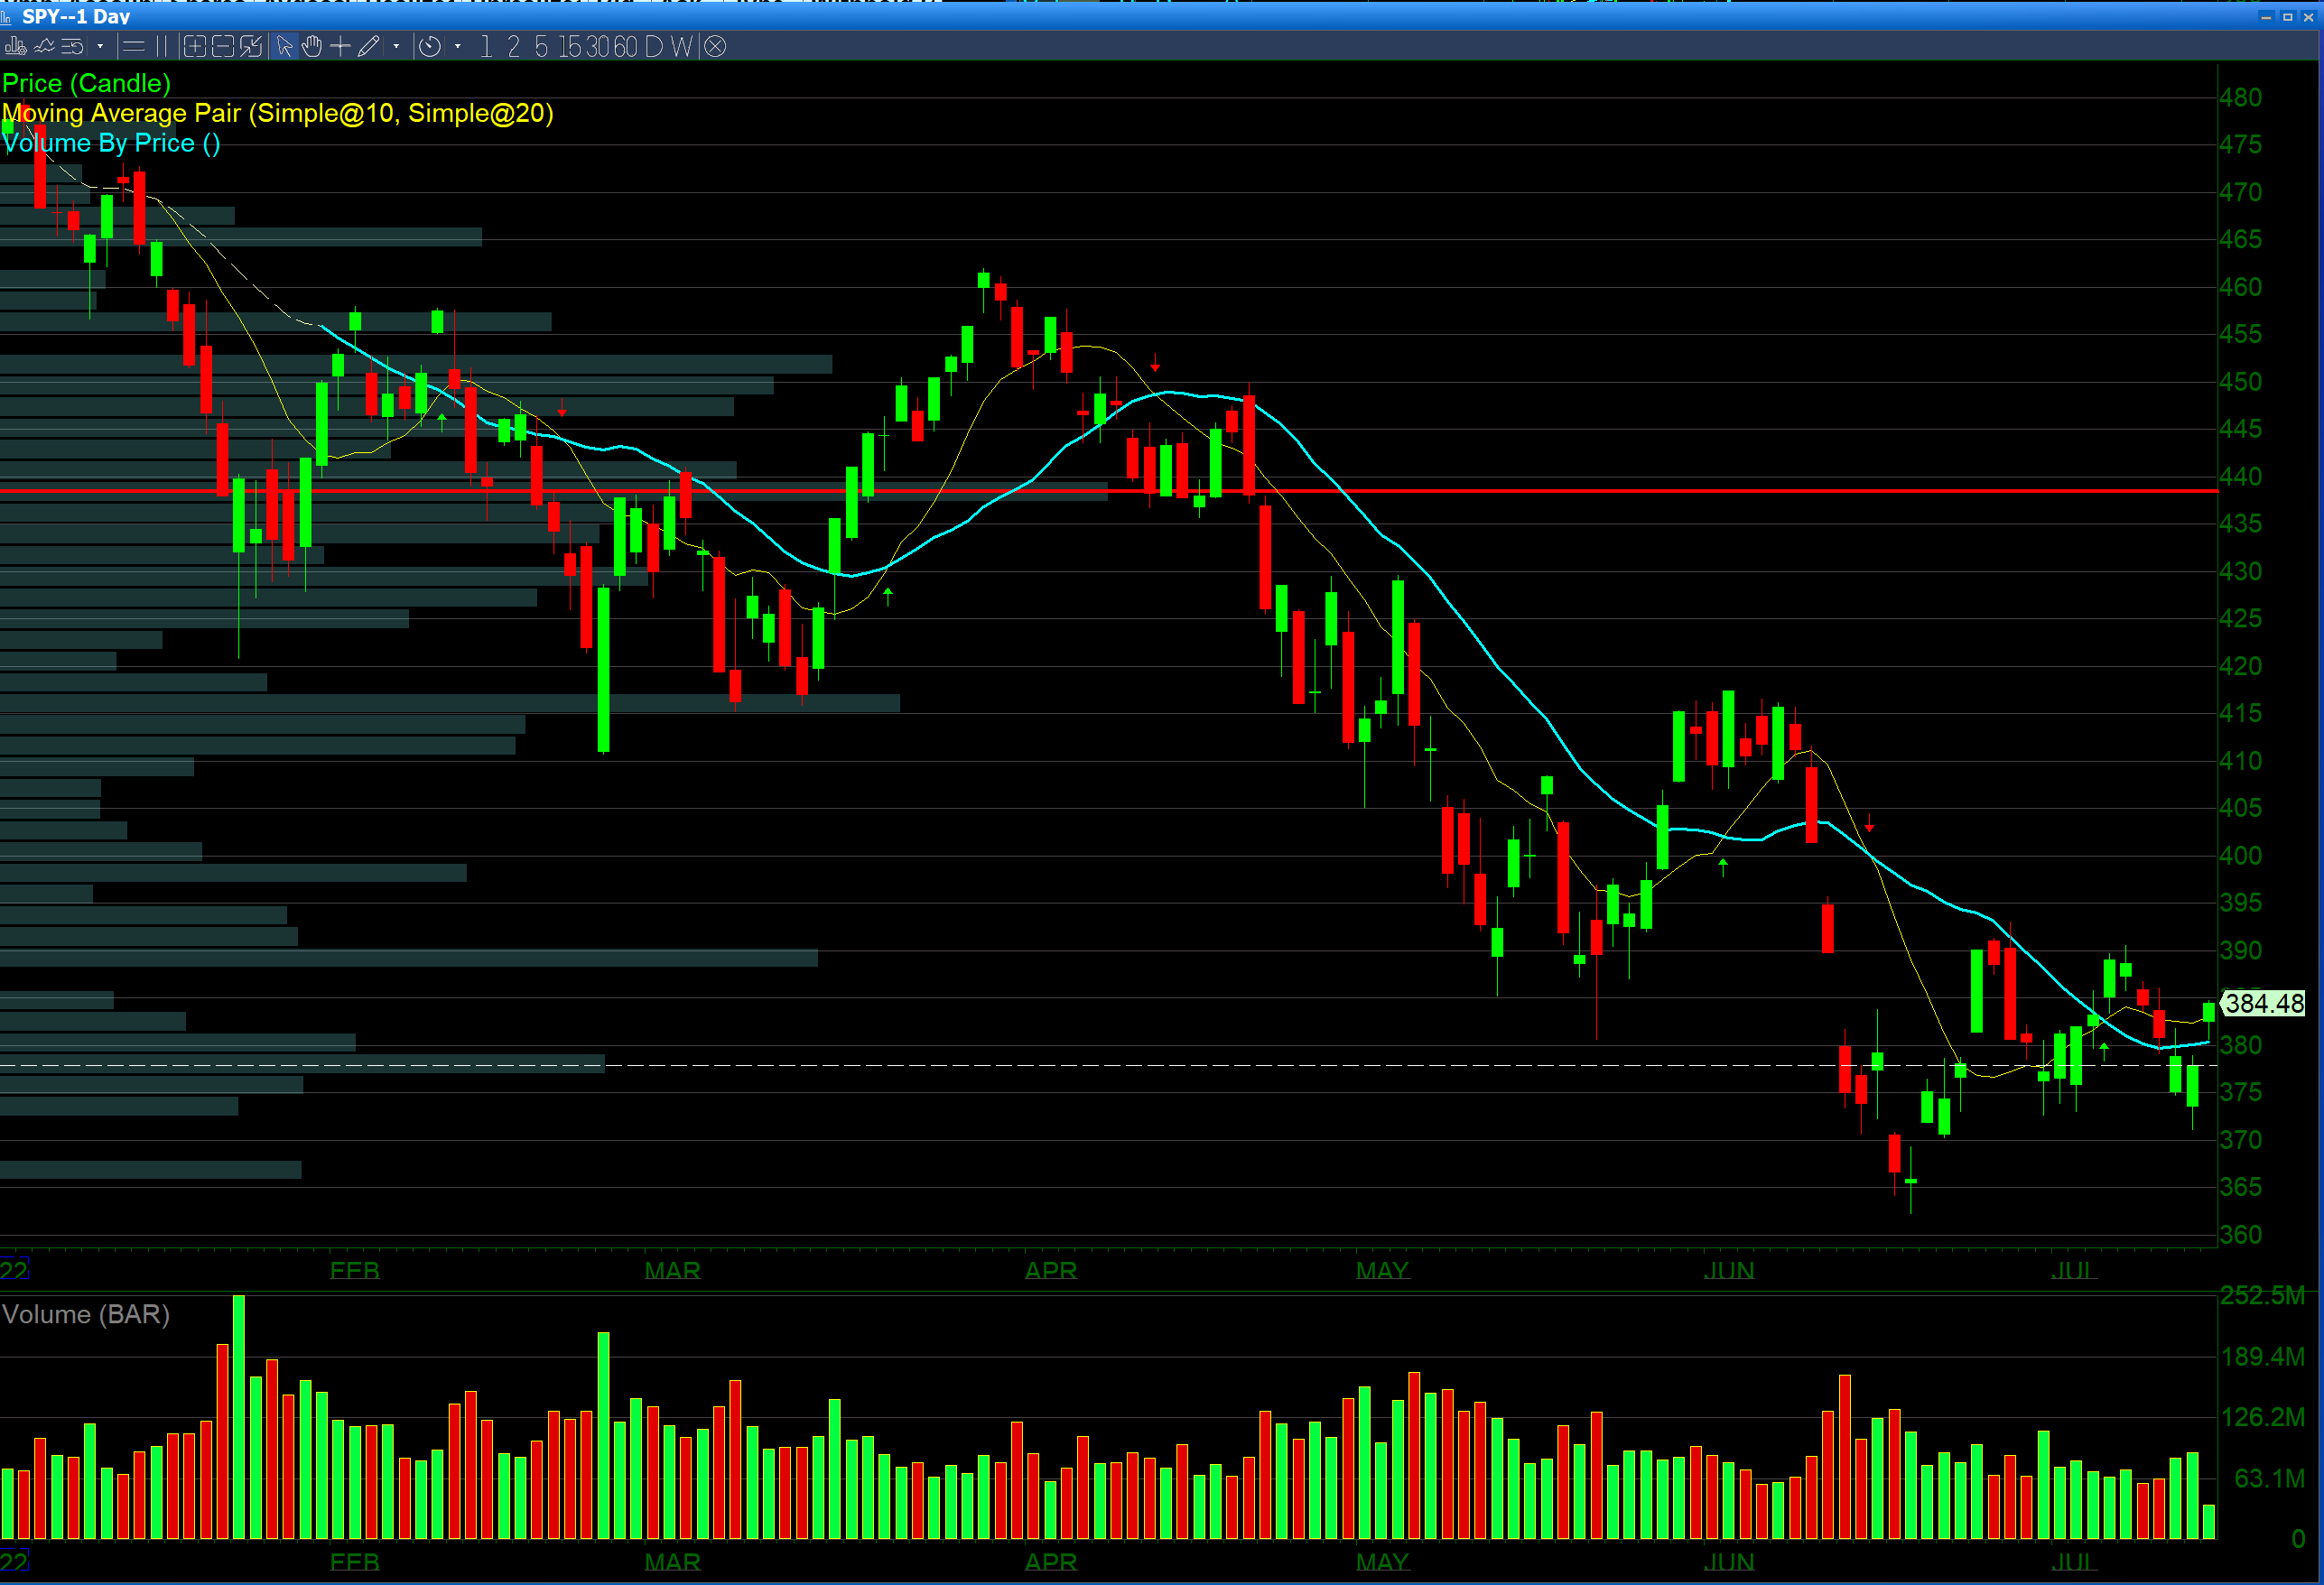
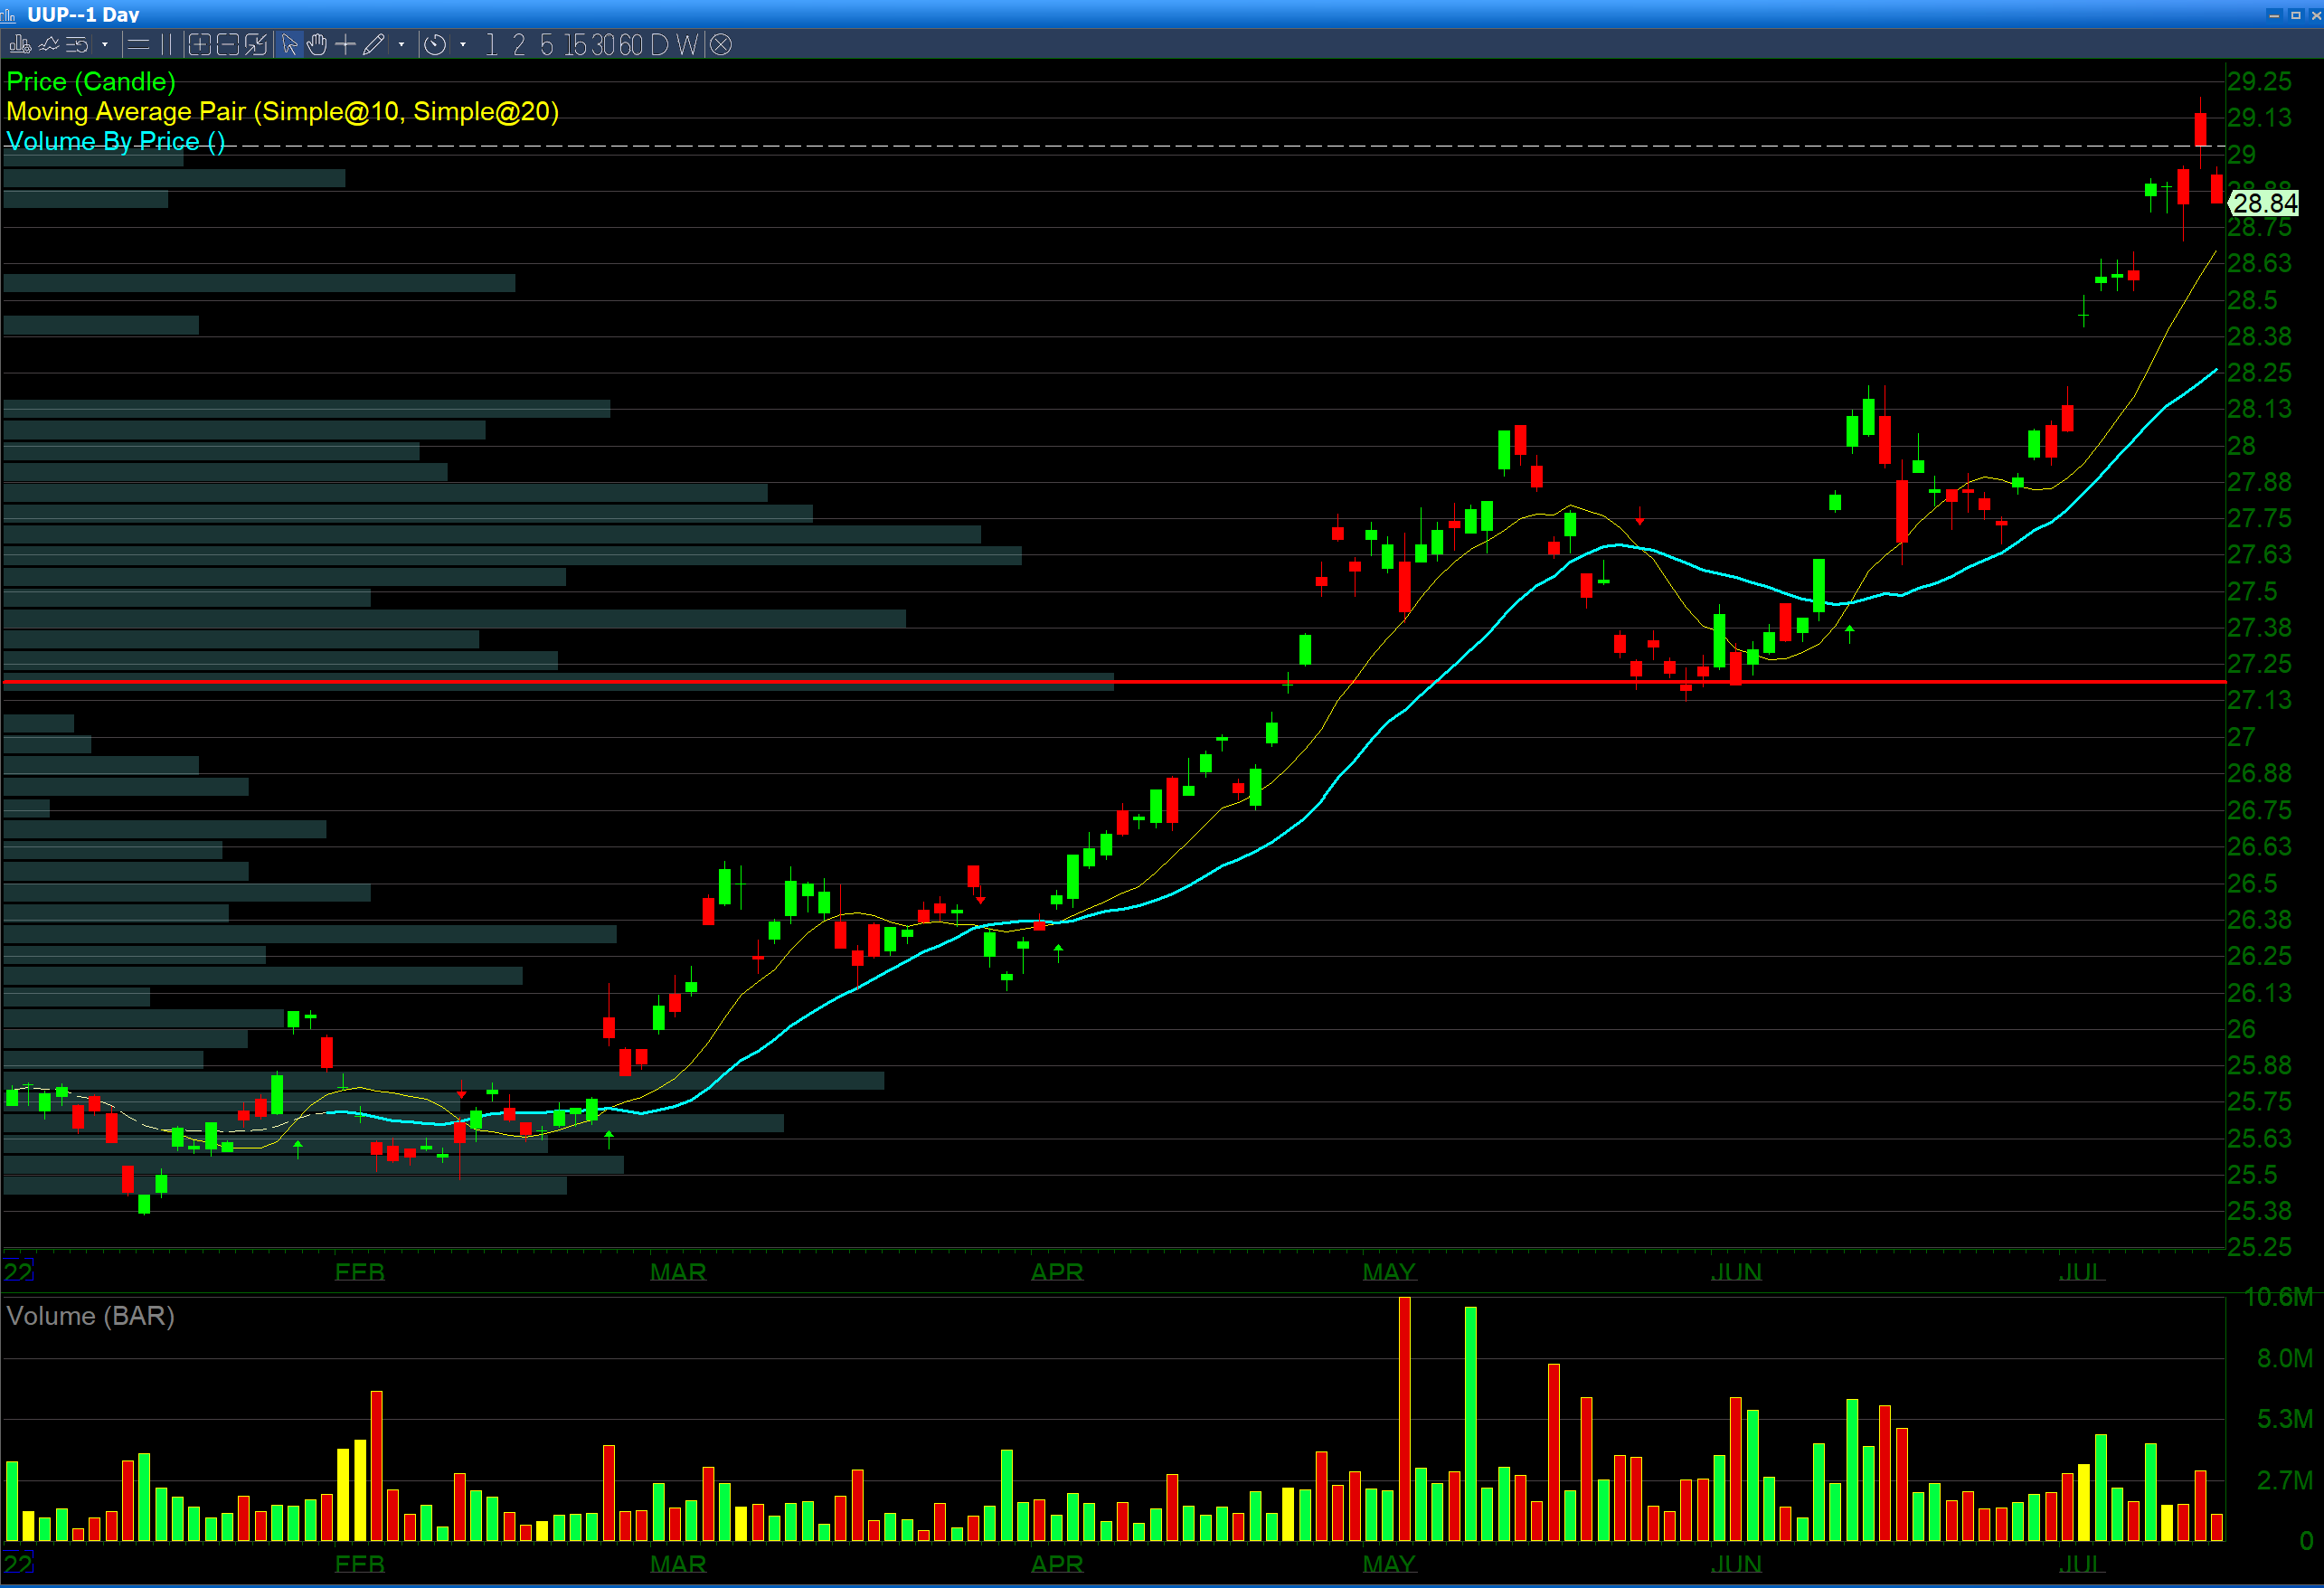
USD/Stock Market Correlation
This is an inverse relationship when The U.S. dollar goes up the stock market goes down. When the USD goes down the stock market goes up. The leading indicator is the USD; its value affects the prices of the stocks listed on the U.S. stock exchanges. In the above two charts, you will see the value of the index ETF, $SPY is increasing while the value of the dollar ETF, $UUP is decreasing.
Summary:
- The USD has an inverse relationship to U.S. stock markets.
- The USD is the leading indicator.
Explanation:
The main correlation in the stock market is the U.S. dollar/stock market correlation which denominated the stock markets. Stocks are valued in U.S. dollars as they are listed on the U.S. Stock Exchange. These companies earn money all over the world as they are global/international companies. When the value of the USD changes, the prices of these companies need to change as the perceived value of the individual companies has not changed, just the value of the underlying currency to which they are denominated.
USD/Gold Correlation
Summary:
- The USD has an inverse relationship to gold.
- The USD is the leading indicator.
Explanation:
Prior to the end of the Bretton Woods Agreement in the 1970’s gold was the basis of the world currency system. Since the end of the Bretton Woods Agreement, the USD has been the reserve currency of the world. Prior to the 1970’s, the USD was backed by gold. Now, it is only backed by the U.S. government’s ability to pay its debt and the strength or weakness of the economy. A floating international currency system with the USD as its reserve currency is a relatively new occurrence.
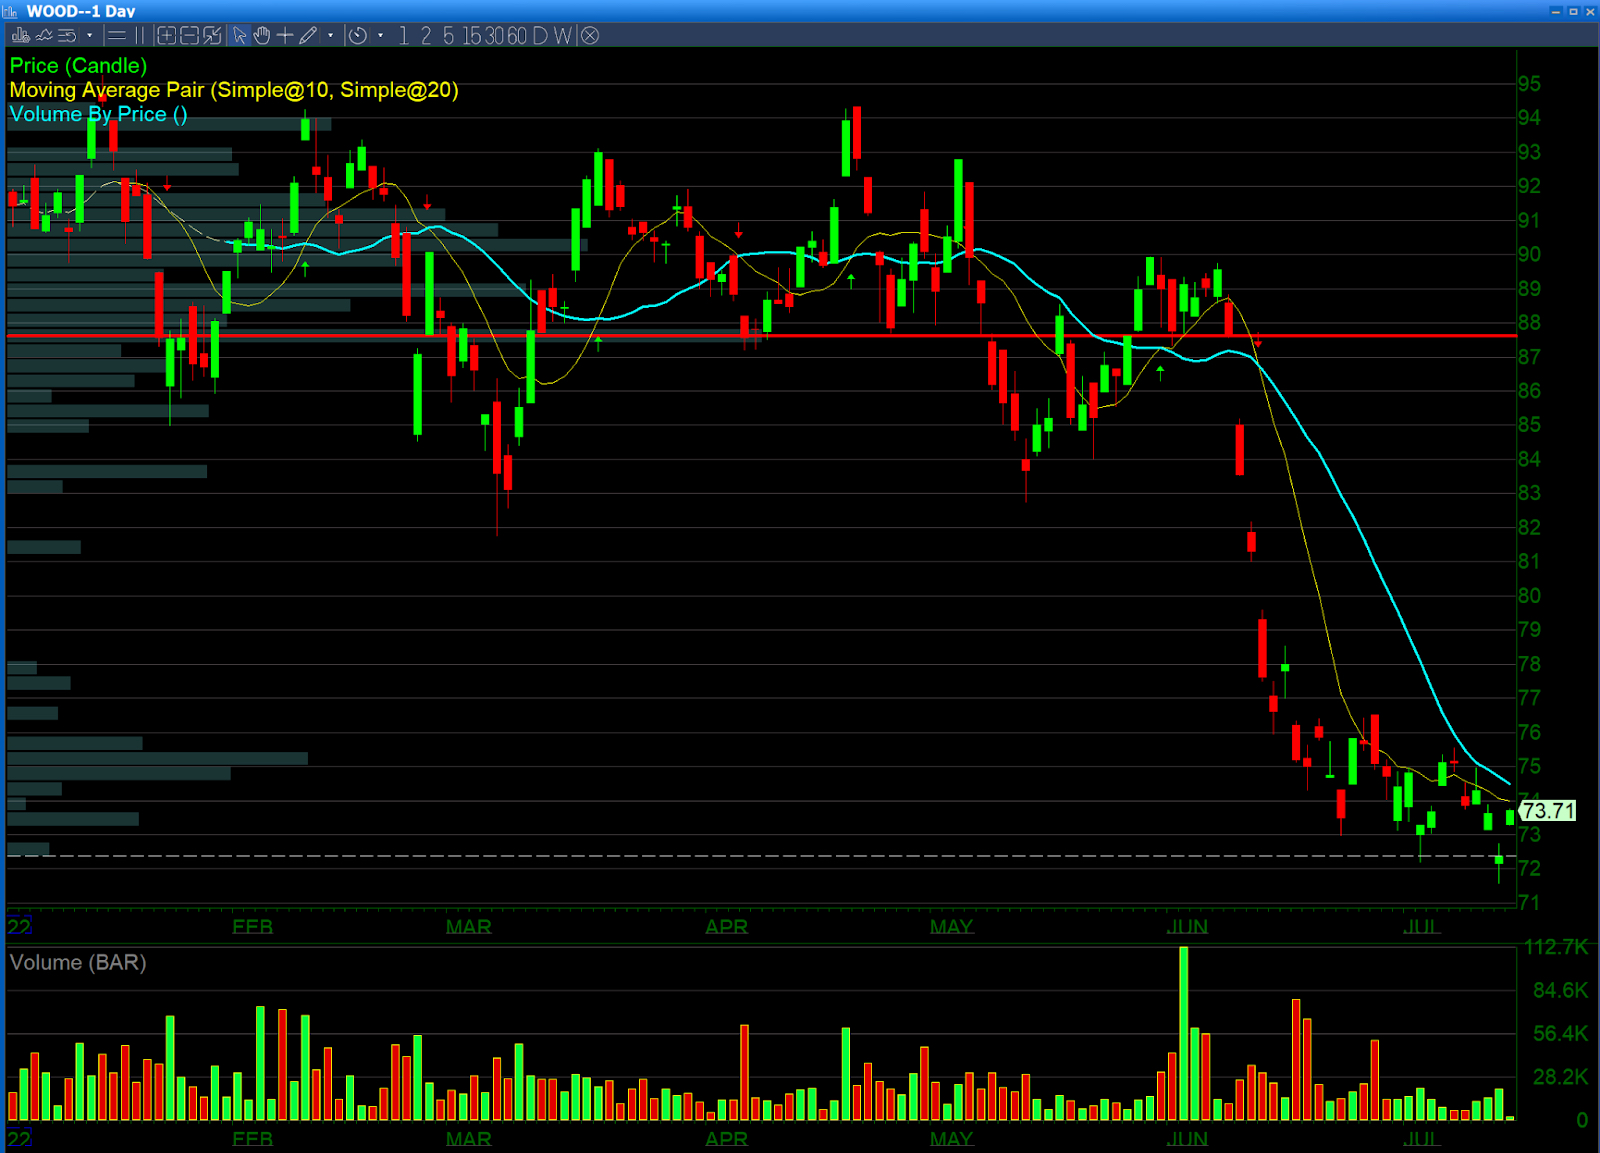
U.S. Stock Market and the Prices of Lumber Futures
Summary:
- The U.S. stock has a direct relationship to Lumber Futures.
- The USD is the leading indicator.
Explanation:
Lumber is an important commodity in the U.S. economy because almost all the homes of the U.S. are built out of wood. It is a key component to the housing construction industry, it is literally a key building block of the U.S. economy. If the stock market is up sharply pre-market, it is likely that lumber futures will follow. A big selloff in the U.S. stock market will lead to a big selloff in lumber as well. This is a direct relationship with the U.S. stock market being the leading indicator.
To conclude these market correlations, keep in mind that not all correlations are 100% predictable. Note the 80/20 rule while using correlations in your stock trading and be aware of any divergence, as this is usually an indication of something irregular that may occur.
Written by Michael DiGioia, Director of Education
Mike is available for One-on-One Coaching. Learn More