In our previous blog, we explained the 4 components or stages of The Market Cycle, also known as The 4 Stages of Market Development. To recap:
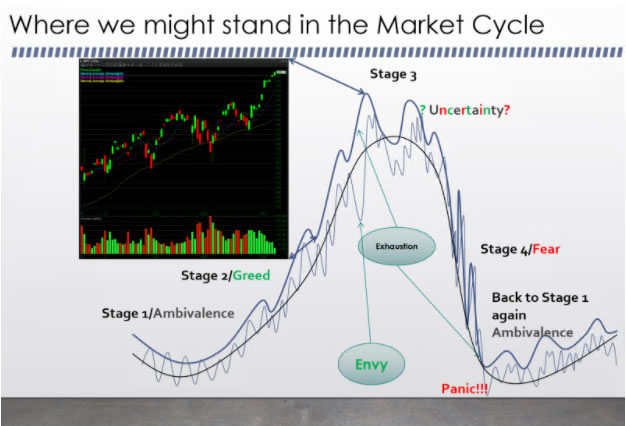
Stage 1: A narrow consolidation made up of equal highs, and equal lows with the prevailing emotion being uncertainty and ambivalence.
Stage 2: The prevailing emotion is greed which leads to a breakout with higher highs and higher lows. Greed and profits drive the markets higher, until prices get so high that people begin to get nervous about their profits. Cracks start to appear in the underlying economy as markets get extended. This brings uncertainty back into the market.
Stage 3: A wide and whippy stage of uncertainty. The big swings up and down are part of the distribution process of unwinding large old institutional stock positions. New highs need to be made to get new buyers in the markets at high prices. These emotional new buyers tend to be retail investors. (This is where we believe we are now. We’ve had a mature uptrend for months if not years, inflation, and problems like the impending end of the eviction moratorium that has been keeping people in their homes and apartments. This does not mean these old slow moving freight trains will end overnight. Markets are slow to turn. Markets get extended and can extend even more. When uncertainty turns to fear that brings us to the next stage.)
Stage 4: A breakdown to lower highs and low or lower lows. When this breakdown occurs it will occur fast as fear is the prevailing emotion. The market falls faster than it rises as fear is far more compelling than greed.
 There are seven market patterns that make up everything that the stock market can throw at you.
1) The sideways consolidation or sideways trend.
2) The breakout range: One item that you should look for in the breakout range are ascending lows. This is a clue that the range is getting ready to break out soon (Bollinger Bands are a great range breakout indicator). Once the range breaks out, it makes a higher high and then pulls back to the area that it broke out from. Next it needs to make a secondary new high to confirm the breakout is truly in full effect.
3) The uptrends which are defined by clearly making higher highs and higher lows. The prevailing emotion of the uptrend is greed. The only thing that causes the uptrend to pause is profit-taking. People take profits when they begin to worry that the trend might be coming to an end.
4) The uptrend line break (UTLB) is the earliest sign that the trend is getting mature, and might be coming to an end. Very often UTLB will only be temporary and the uptrend will resume and the break will not mean much. A true UTLB will be on a bigger timeframe (Daily or Weekly Chart) and confirmed on multiple time frames.
5) The breakdown: This occurs after multiple uptrend line breaks. Fear finally takes hold and leads to a breakdown which causes a cascading effect.
6) The downtrend where fear is in full control of the market. Waves of selling come in and the market will feel like a waterfall. Markets that breakdown with fear move faster than they rise on greed.
7) The downtrend line break (DTLB): This is usually called a capitulation and then a sharp snapback. We call it the downtrend line break and it might not happen just once. The Downtrend Line Break can happen a number of times as the slope of the downtrend line gently gets less steep over time. DTLB repeat until they become a sideway trend.
Be sure to use your new knowledge of the 7 market patterns and the 4 stages of the market cycle when trading stocks. Even when trading Exchange Traded Funds (ETFs), be sure to ask yourself what stage we are currently in and which patterns we resemble the most.
Trade well everyone.
Written by Michael DiGioia, Director of Education
Mike is available for One-on-One Coaching. Learn More