Before we jump into this technical pattern, it is important to stress that trend direction is far more important than a simple technical pattern.
Time Frames as they Relate to Technical Patterns
The time frame that the 1-2-3 continuation pattern occurs on is important. Generally, this pattern works better on longer time frames. For example, a 1-2-3 continuation play on the weekly chart is about five times more powerful from a technical perspective (price and volume) than a daily 1-2-3 continuation play. The same is true for a 5-minute 1-2-3 continuation play versus a 1-minute 1-2-3 continuation play. This element of multiple time frame analysis is not exclusive to the 1-2-3 continuation long. One weekly bar includes five days of price and volume data. One 5-minute bar includes five times more price in volume data than a one minute bar.
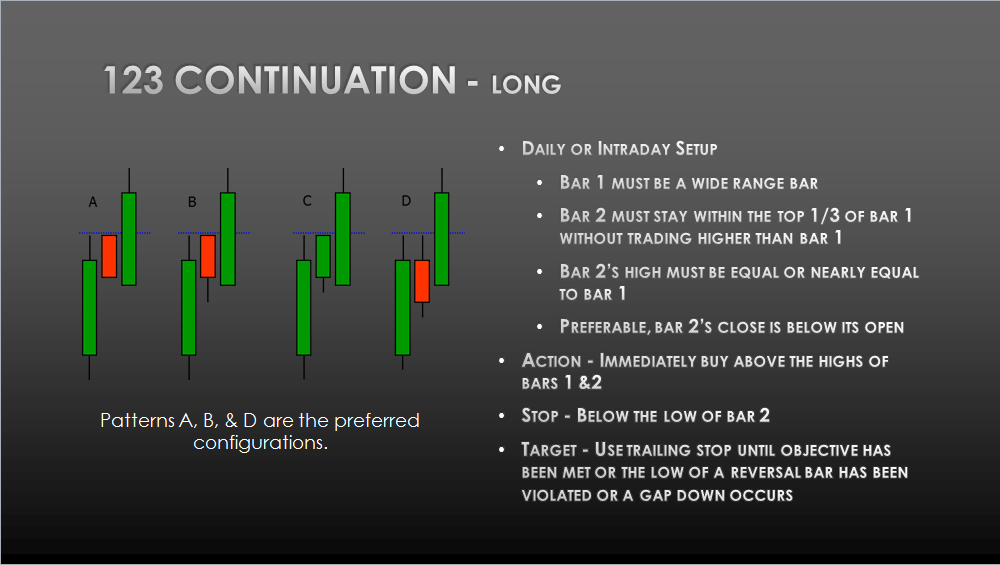
Let’s look into the 1-2-3 continuation long set up. First, you’ll need a wide range green bar which indicates a lot of traders are getting long and buying the stock. The volume should be higher than average. The next bar should stay within the top 1/3 of bar one. The volume should be lower than average, indicating that some traders have taken profit but most traders have stayed in for a bigger move. Bar two should be red as that will shake some of the loose hands out and make the trade more powerful when it swings back to the upside. Please note that bar two is red because the close is below its open. This gives you an opportunity for a discretionary entry as well as the normal technical entry. We will cover the difference between the discretionary and technical entry, in a future lesson.
The action is to buy on bar 3 when it breaks above the high of bar 1 and 2 (this is the technical entry). This is a resistance break of the prior two period highs. The stop goes below the low of bar 2. The nice thing about the 1-2-3 continuation play is that your stop is close by. Your target is to use support and resistance from the left of the chart to put your target just below some prior resistance level. If you’re trading this pattern on a daily chart, then a gap up would also be a good place to sell. If you are trading this higher on a daily chart and a reversal bar forms, that would also be a good place to sell.

Above we see a good example of how you can trade this pattern using two time frames of confluence. The large green bars indicate the five minute time frame. The small green bars indicate the one minute time frame. By using these two time frames together you can get in at the low of bar 2. It is tighter than a technical entry, and it will help you have less risk and more reward inside the pattern itself.
It is important to note that the 1-2-3 continuation play works best in the direction of the trend. The pattern is not a particularly big pattern unless it continues to trend in the direction that it was going in. It is a great gateway to enter a strong trending move.
Trade well.
Written by Michael DiGioia, Director of Education
Mike is available for One-on-One Coaching. Learn More