
All-Time Highs and Movement into Value
As traders and investors, we need to keep an eye on the big picture at key moments as markets will move from one extreme point to another looking for value or opportunity. The month of July ended with a pretext for a rapidly approaching previous all-time highs that was established in 2021 and what was seen in January 2022 prior to a market sell off. Most of these gains were achieved in the technology sector over the past month. This was driven primarily by the hype in AI (artificial intelligence).
Below is the monthly chart of the $QQQ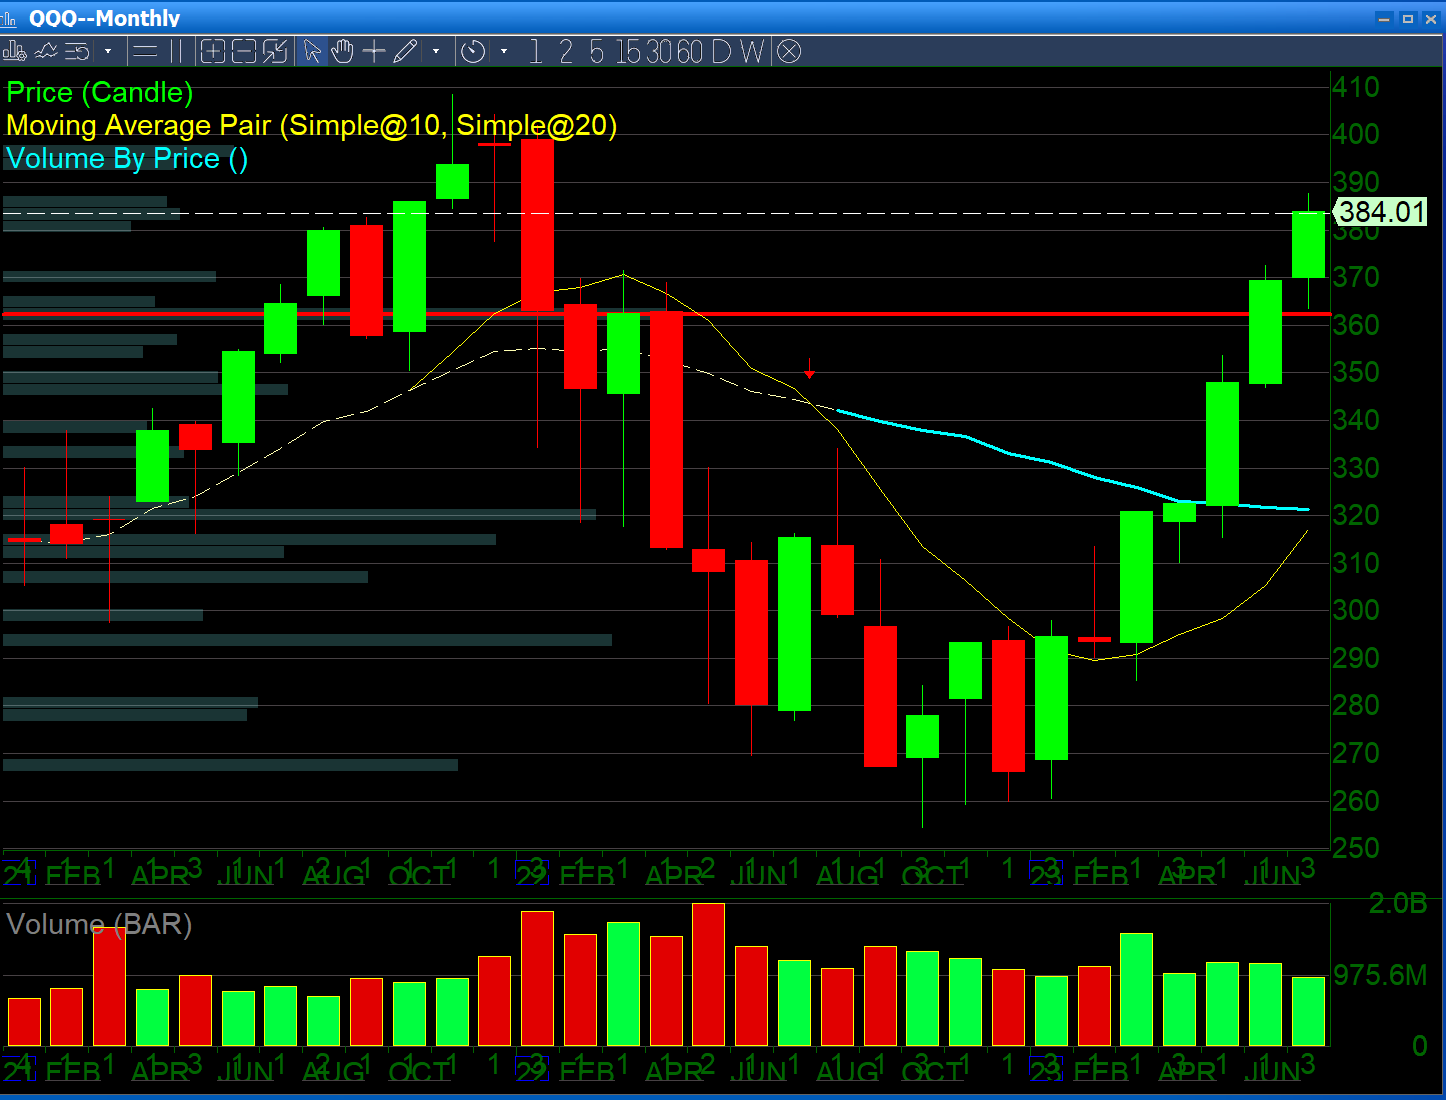
The charts pictured above and below show money rotating into the $DIA as the $QQQ experiences profit taking or the potential for a double top reversal.
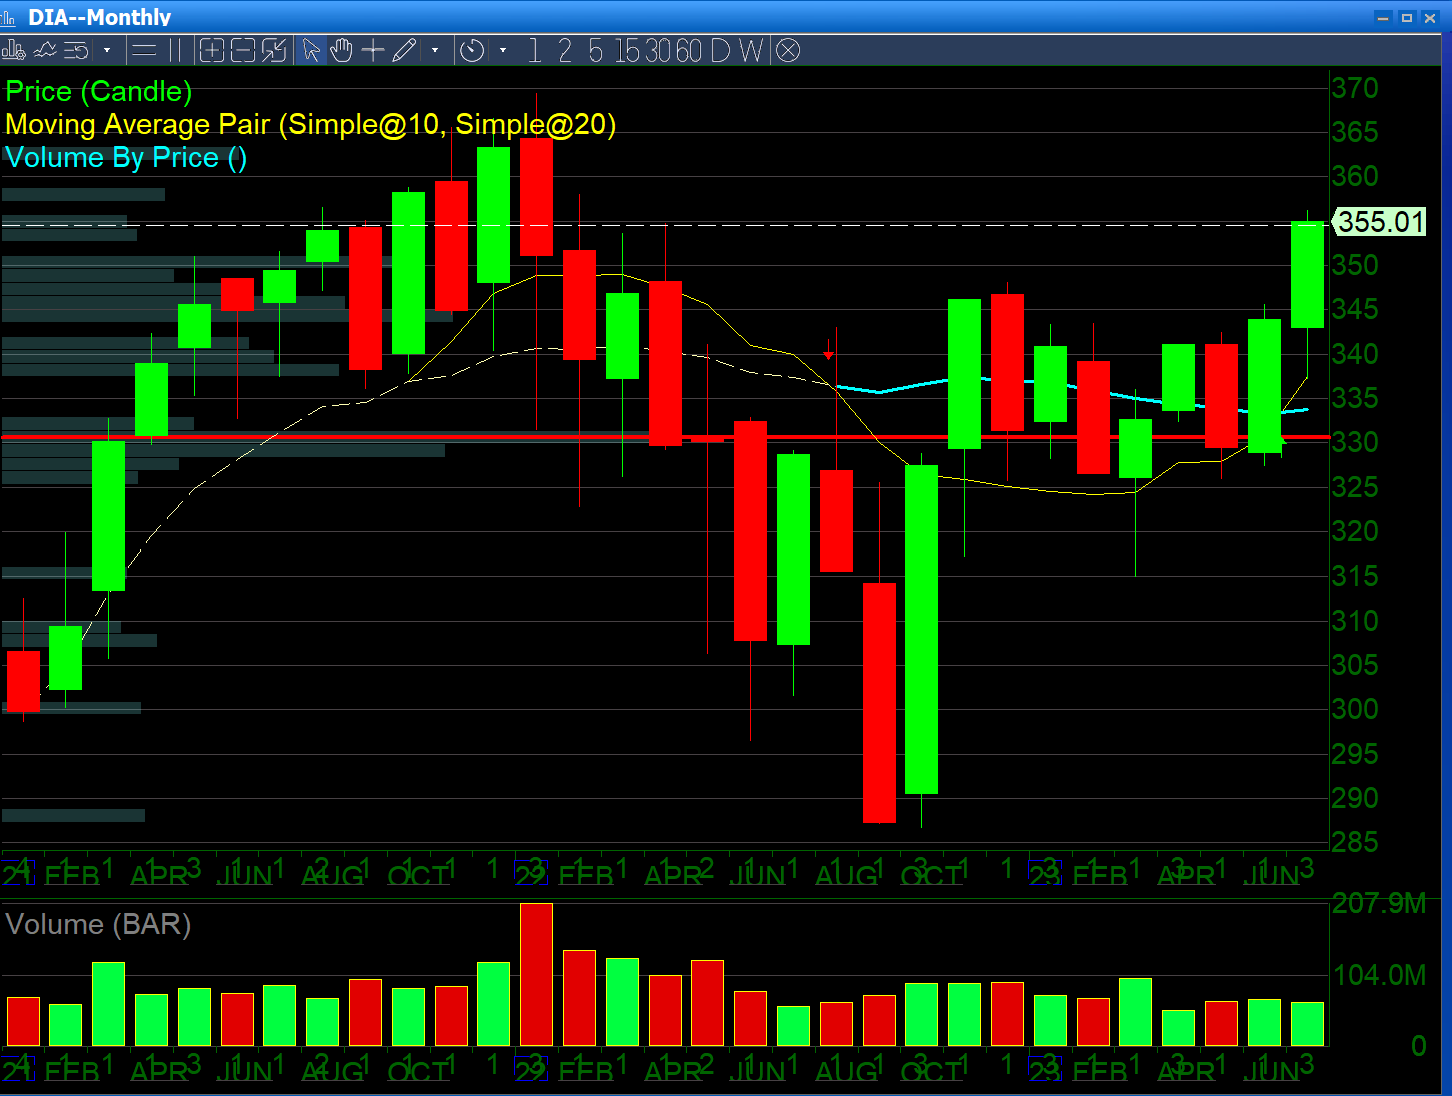
On both charts above, we can see that current up volume is far lower than the previous bars. At these key areas volume becomes pivotal.
What about the Technicals?
Understanding market mechanics is important for traders and investors alike. Markets will continue to move based on technicals until a catalyst changes the paradigm. Let’s dive into what this means as technical analysis works exceedingly well in the “in-between” time in the middle of fundamental news catalysts. That is exactly what is going on in the current market as it is summer time, and if no news comes out, the market will just be managed on a technical basis until a news catalyst changes the outlook for the stock.
Important things to remember are that August tends to be one of the lowest volume months of the year, so if we rise to a new technical high for the year that lines up with the 2021 prior high, it will be a low volume double top, which is an extremely bearish technical pattern. Also note that a breakout on the Dow due to money rotating out of technology into value and industrial stocks would be a low-volume breakout, which usually leads to a fake out and also a bearish technical pattern when looked at in the big picture.
But markets don’t trade just in one time frame; in the short term meaning the current month, we are still in a short term bullish market, even though we are setting up for a bearish reversal going into the fall. We will be releasing a lesson on multiple time frame analysis in the near future.
What Does Oil have to say?
Another important indicator is that the price of $OIL, the oil tracking ETN looks to be on the rise with a bullish monthly engulfing bar. This could potentially be a news catalyst, setting up for future high inflation, which is visible in the chart below.
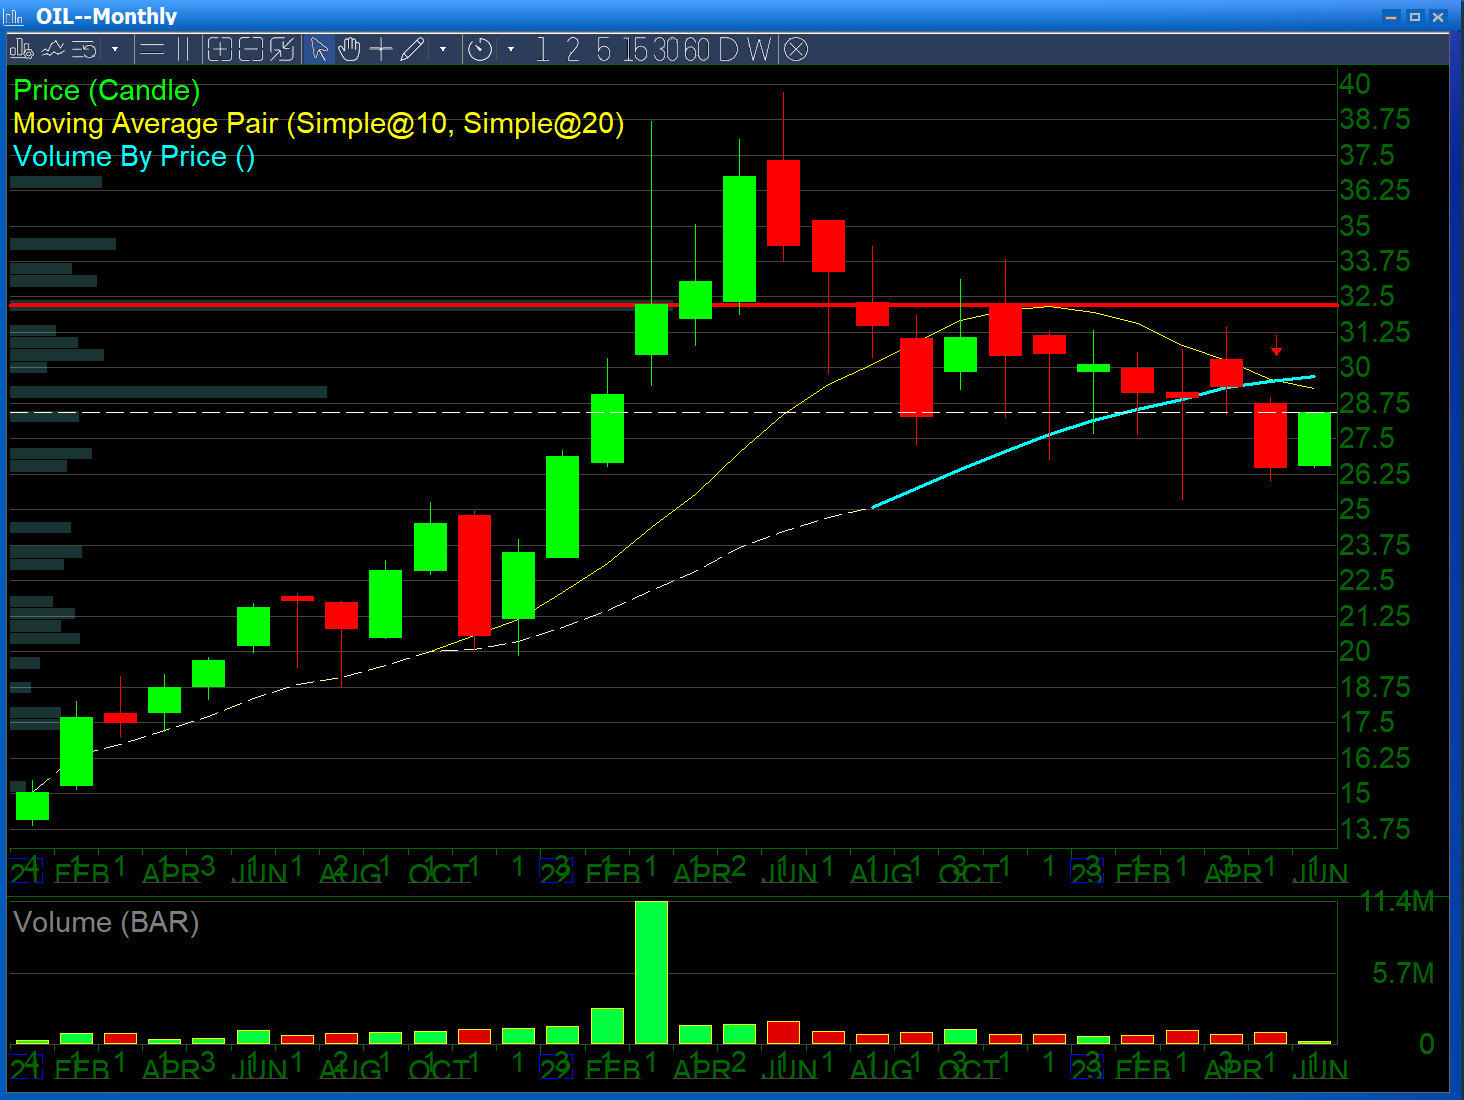
Saudi Arabia previously reduced their production, therefore, cutting oil supply going into the summer months, just as oil demand is increasing. An increase in the price of oil would cause inflation to return as oil is the prime commodity that must be factored into the product price of all other commodity products, as it is used for production and transportation.
The reemergence of inflation could potentially be a catalyst for a bearish market selloff going into the fall of 2023, so traders and investors need to be aware of these big picture technical, and fundamental setups that are developing, even though the current market conditions are still bullish.
Written by Michael DiGioia, Director of Education
Mike is available for One-on-One Coaching. Learn More