To begin, we’d like to wish a Happy Independence Day to everybody in the United States. This year’s July 4th celebration will definitely have new meaning to us all. Some places in the US are finally coming out of lock down, while other places in the country have returned to lock down measures.
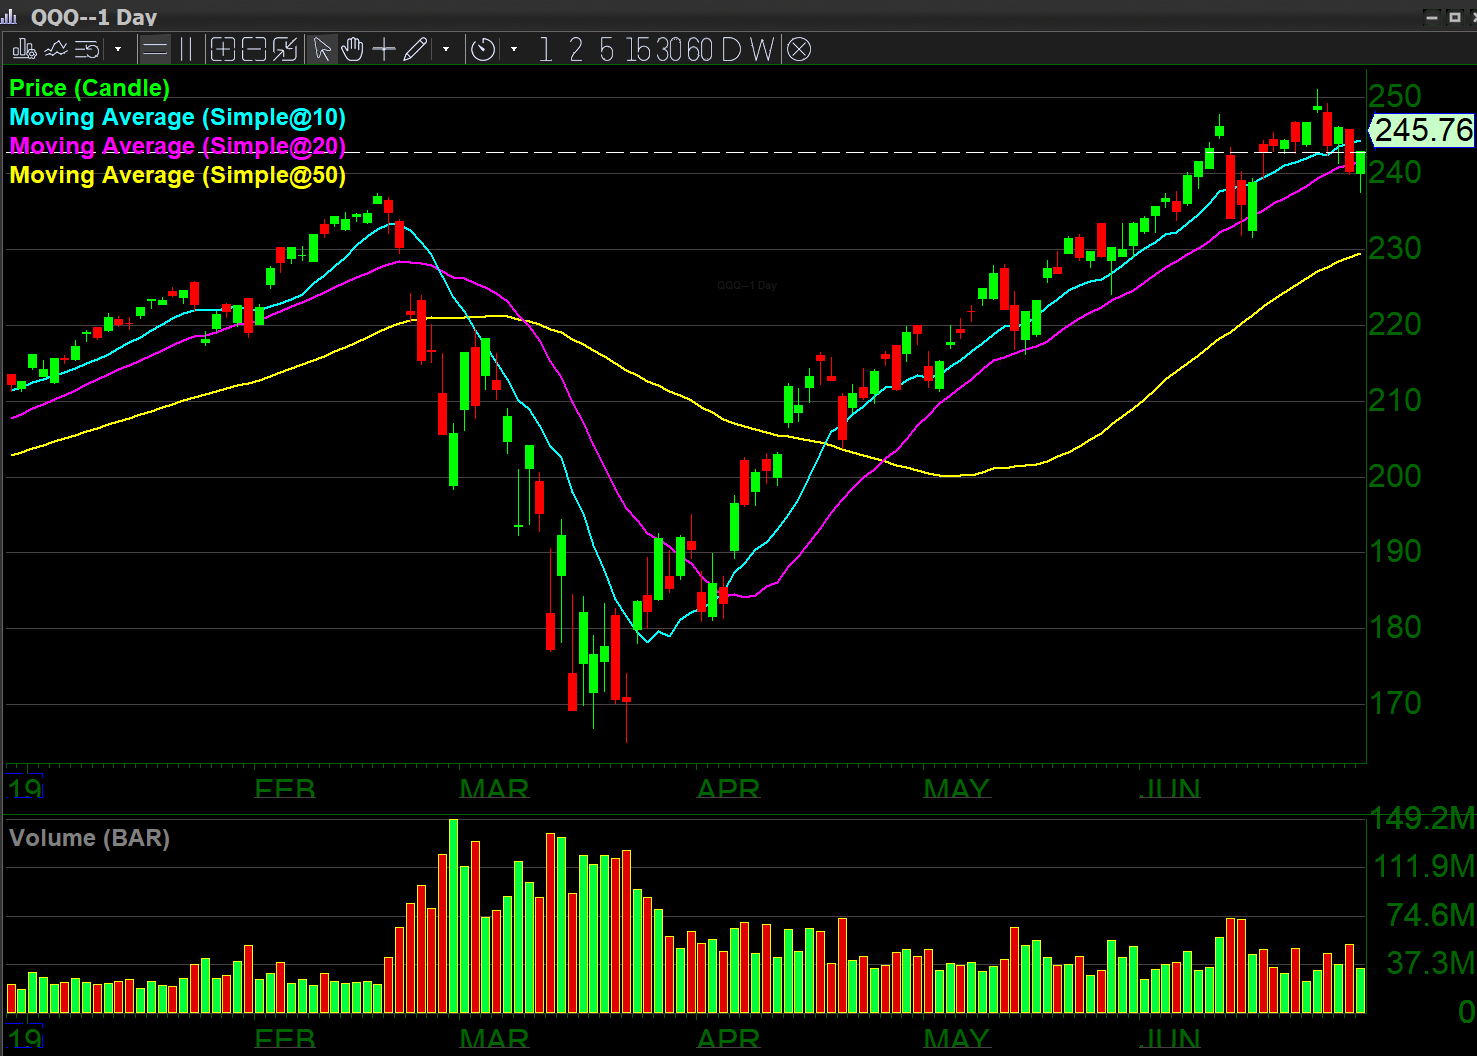
The post Covid-19 reopening rally seems to have come to an end. Over the last eight weeks, we have seen a choppy, low volume move up into the area of prior highs on the $QQQ. In fact, the $QQQ reached a new high 251.15 exceeding the prior high of 237.47. Also Technical Analysis is traditionally very suspicious of a shallow new high. As it is often a ploy to attract new buyers just before a sell off.

For educational purposes, we wanted to explain the differences between the three types of economic recoveries. The first is a V-shaped recovery which indicates a very sharp quick recovery. It looks like the letter V, very similar to the way the $QQQ currently looks (see the chart provided above and below). The other two less bullish alternatives are the U-shaped recovery, and the L-shaped recovery (Japan’s Economic Recovery in 1990 is the most famous example of an L-shaped Recovery, a slow flat return to normal). These are slower recoveries showing that the market took more time to rebound after an economic crisis.
A V-shaped recovery can also turn into an M-shaped top. As you can, see a ‘V’ fits into the middle of an M. There have been lots of concerns that the sharp V-shaped recovery might just be an M-shaped top for a much longer market decline, which may be the case with the coronavirus pandemic and pursuant to a recovery; as the full ramifications of the pandemic and economic recovery will most likely linger for a very longtime.
In comparison to the $QQQ, the $SPY and $DIA have not been as strong; they have retraced over 75% of the move down.
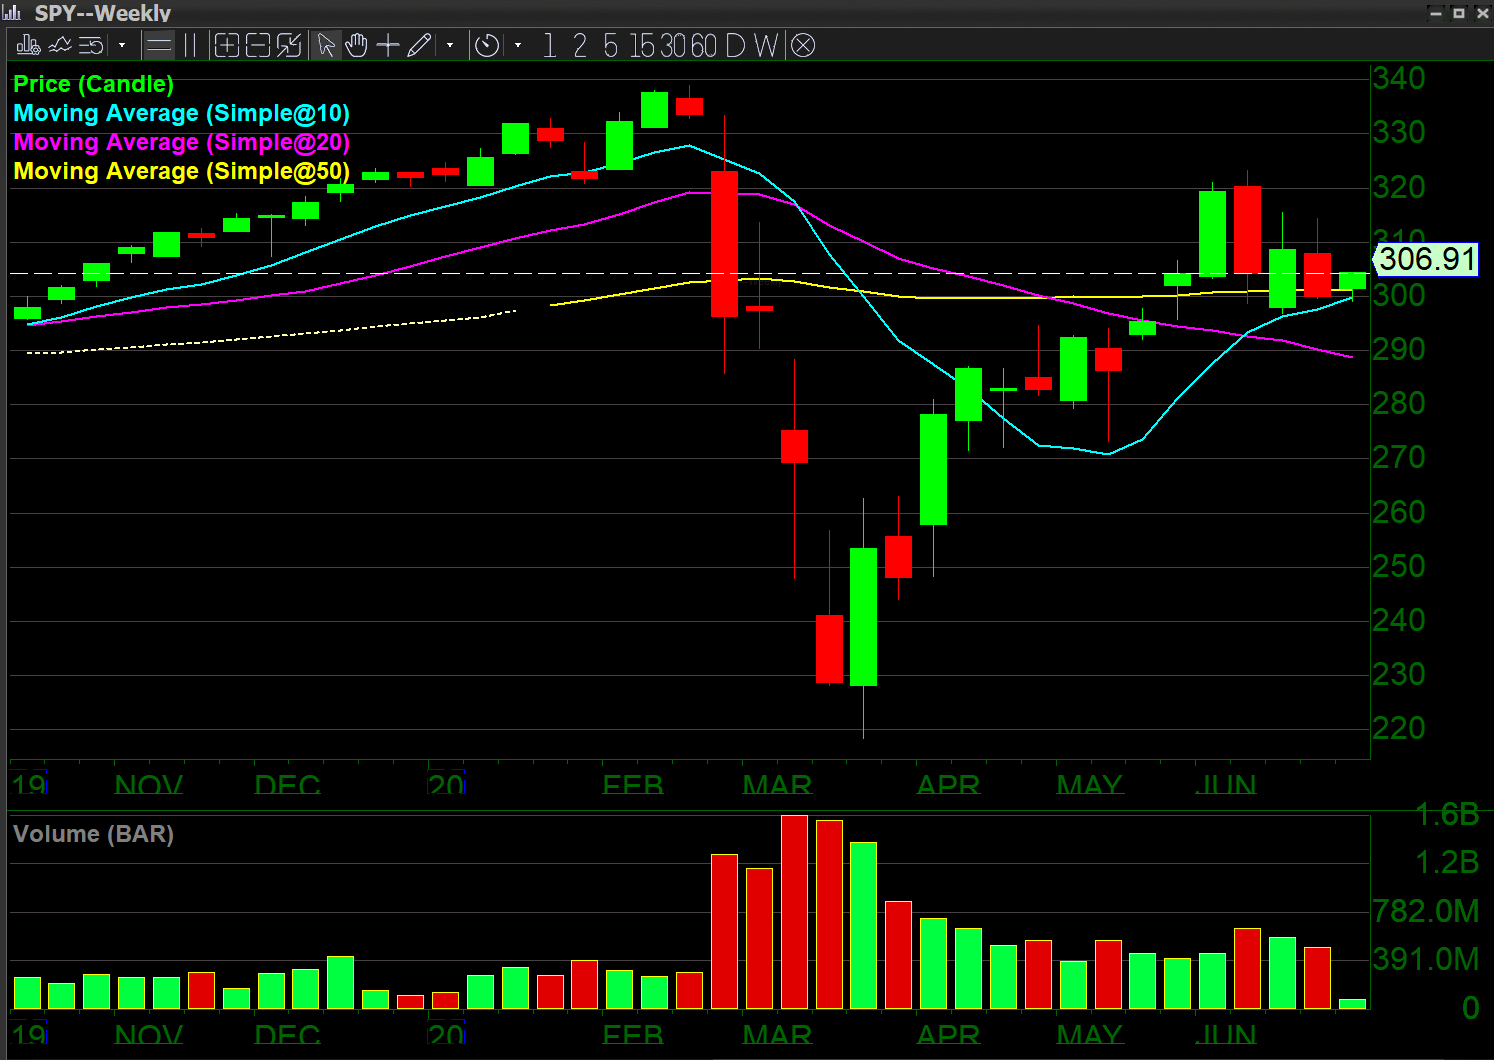

On the above weekly chart of $SPY and $DIA, both seem to be at the weekly breakdown or bounce point.
Also significant is that banks and oil stocks have dragged on the $SPY and $DIA. The latest round of bank stress tests have started to show signs of banking issues. Watch the big bank, $JPM.

The above weekly on $JPM is looking like a Bear Flag which is far weaker than the overall markets. This seems to be a trend also on the weekly chart for $BAC and $C below.
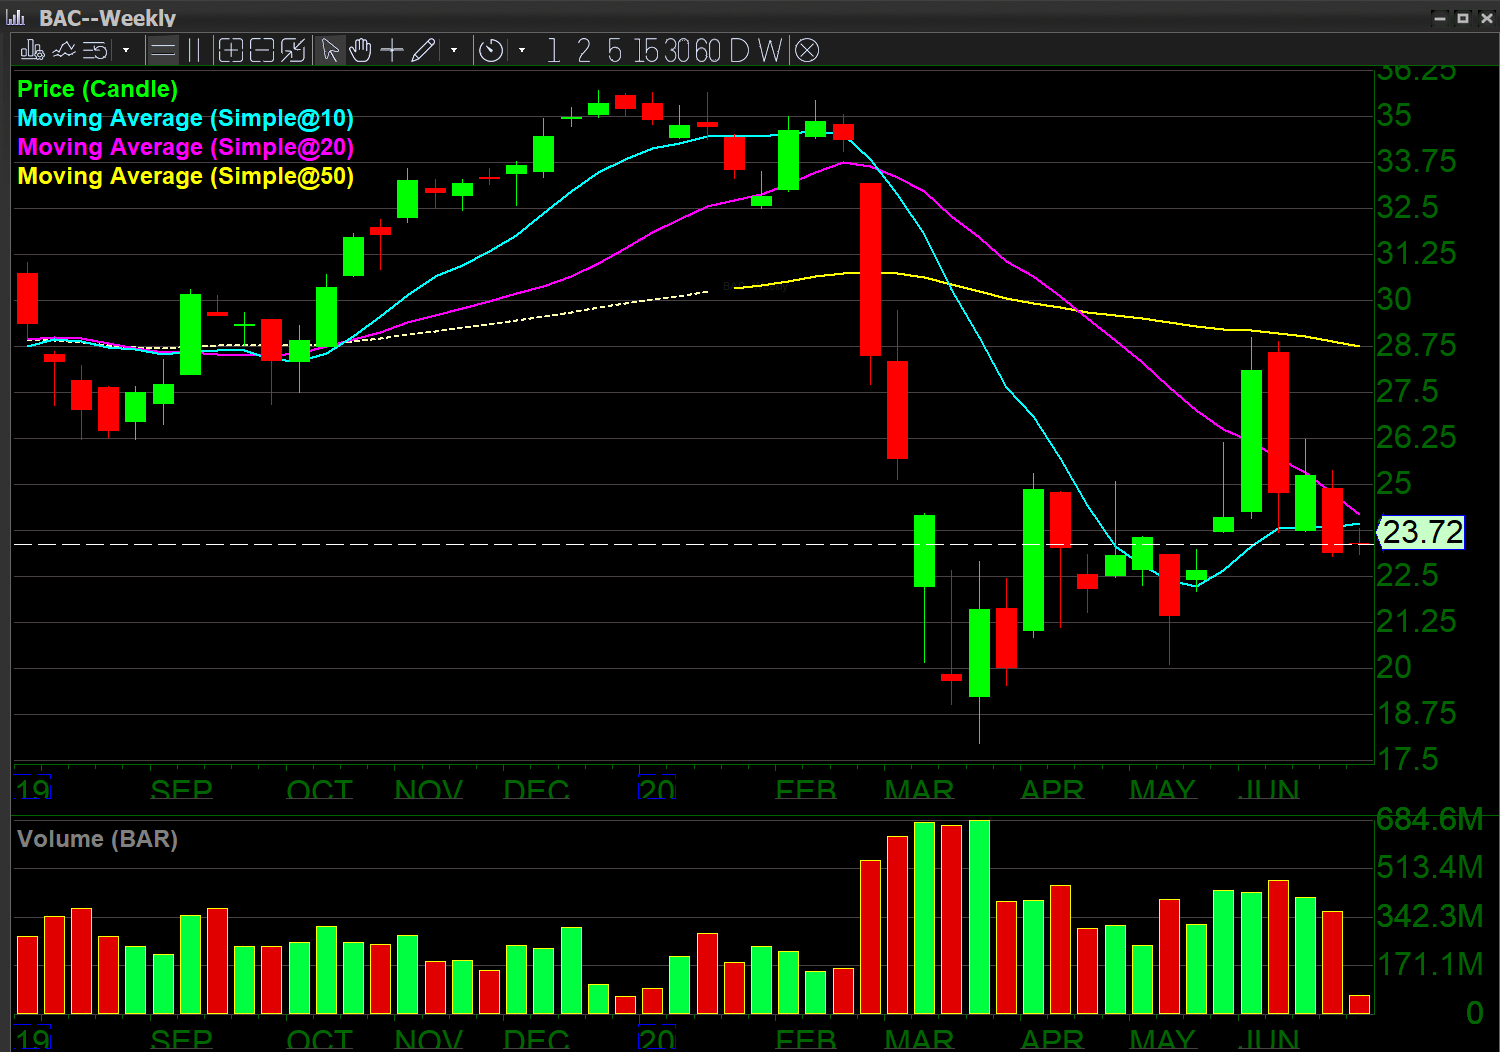
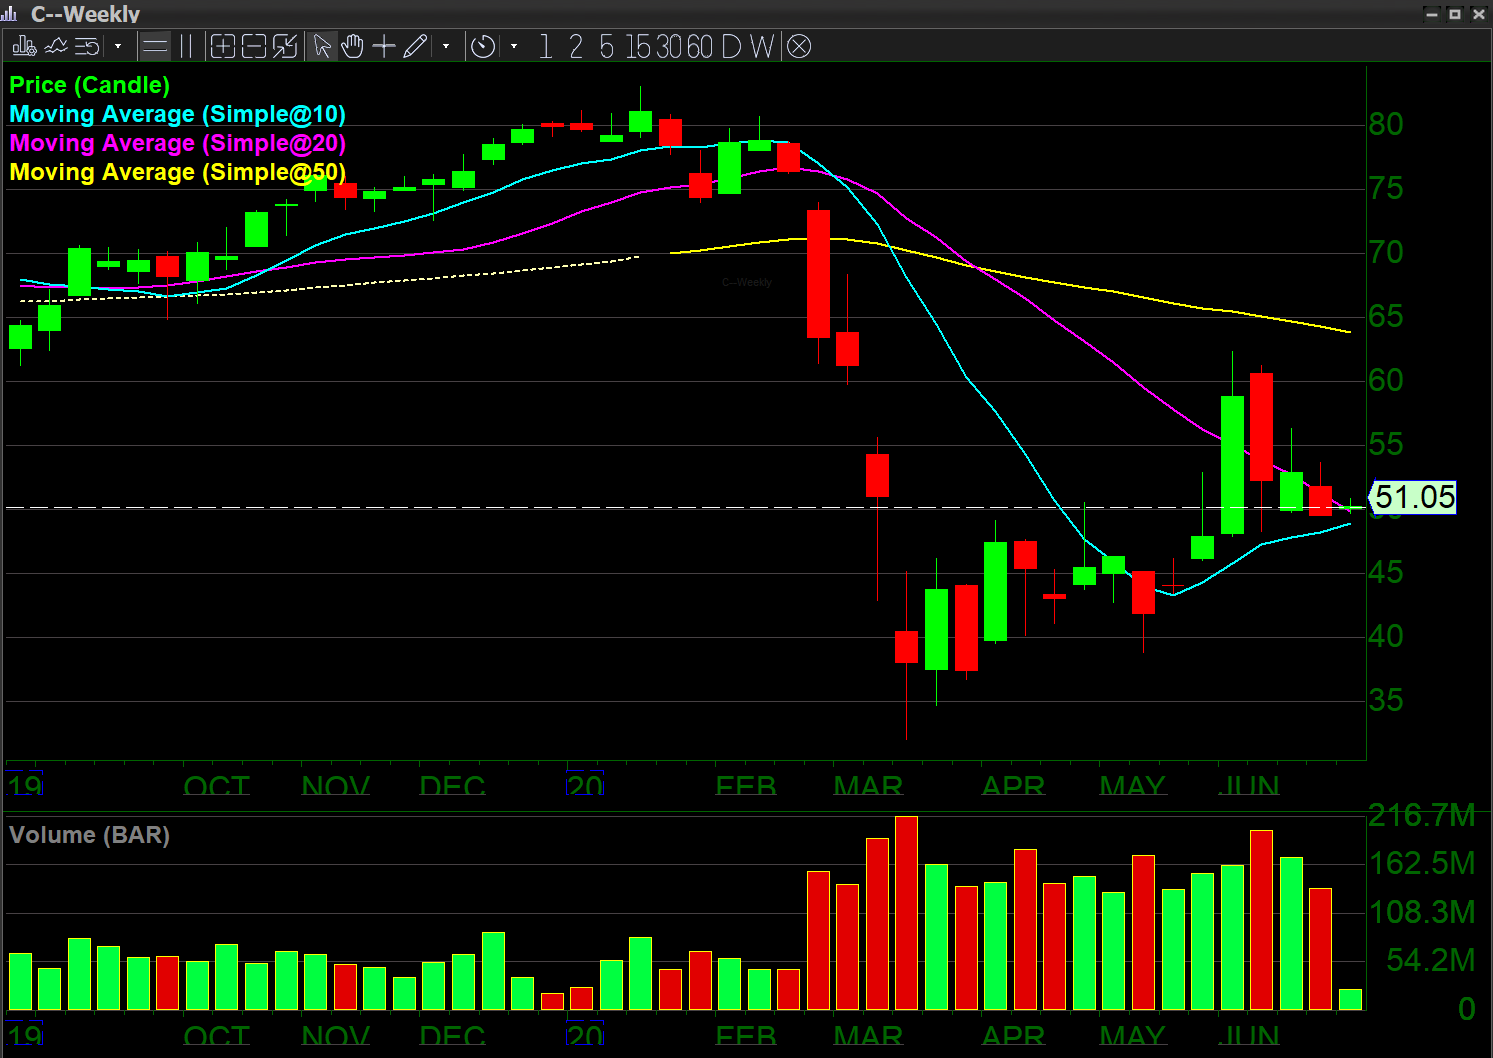
As you can see, all 3 banking companies have almost identical weekly charts.
Of note here is that there cannot be a continued market rally with bank weakness.
The new round of closings in the gulf states have negatively impacted the oil service sector and related companies.

$XOM: we are using Exxonmobil as the oil benchmark, which is also showing a downtrend and Bear Flag formation.
Important Reminder
Fundamental analysis often takes a long time to catch up with the technicals and news,but the hard reality of the fundamentals usually catches up to the markets bringing it back to its senses. The markets have generally been taking a wait-and-see attitude. It has basically been factored in that the second quarter will be nonexistent. It will be floated by stimulus packages and other government measures. Due to this, no move to the down side has happened yet. Unemployment has reached all-time highs and seems to be staying there, despite the partial reopenings that have started to occur. The current official American rate stands at 14.7% unemployment.
What to Watch For
Investing in the stock market at these high levels during a global pandemic does not seem like a rational thing to do. Sitting and waiting for things to become clearer seems like the most prudent plan.
Our suggestion is to watch for a reversal in the stocks that led the markets higher. Most of the value that has been added to the stock market over the last two years were the FANGA stocks: $FB, $AMZN, $NFLX, $GOOG and $AAPL. Surprisingly, these might be the stocks that lead the market down. Facebook ($FB) has recently been under pressure due to additional advertising concerns and should be watched as a potential short going into the 2020 election.
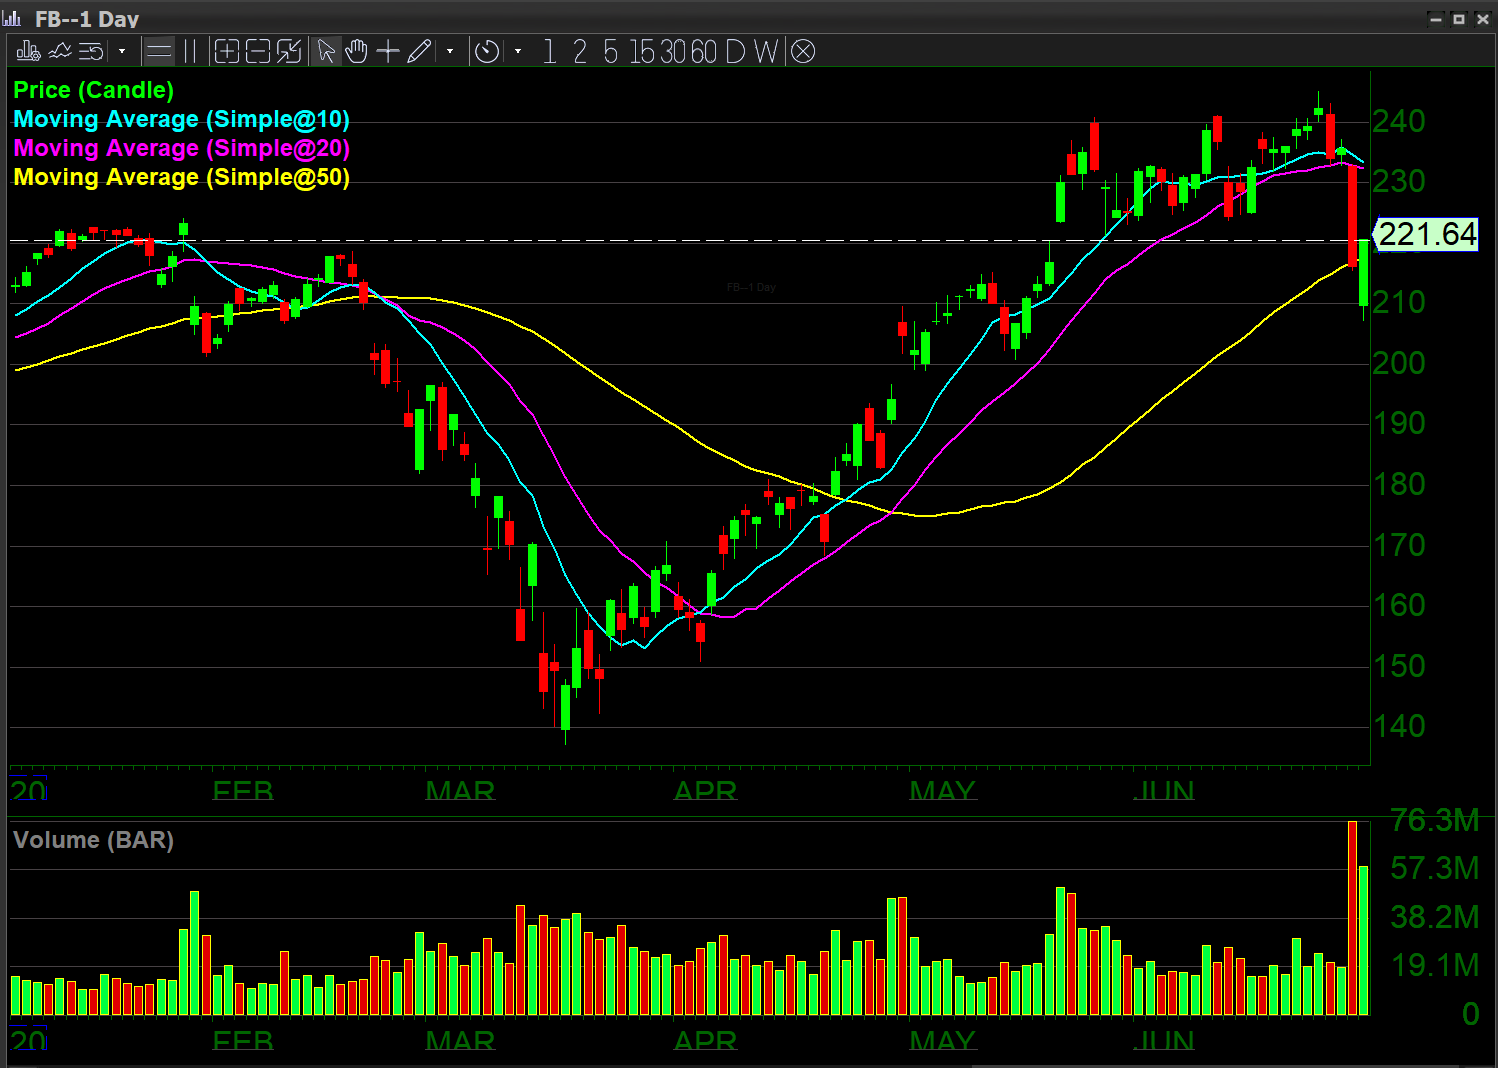
The $FB 1 day chart looks like it might be broken. It crossed the 50MA and has lots of clear air to the down side as many large advertisers cut their social media spending. This is possibly the first crack in one of the FANGA Stocks.
The market rallied on the reopening of the US. If there are signs of additional closures and states closing down their economies again, that should lead equities to decline, regardless of the cheap money the Federal Reserve has pumped into the economy.
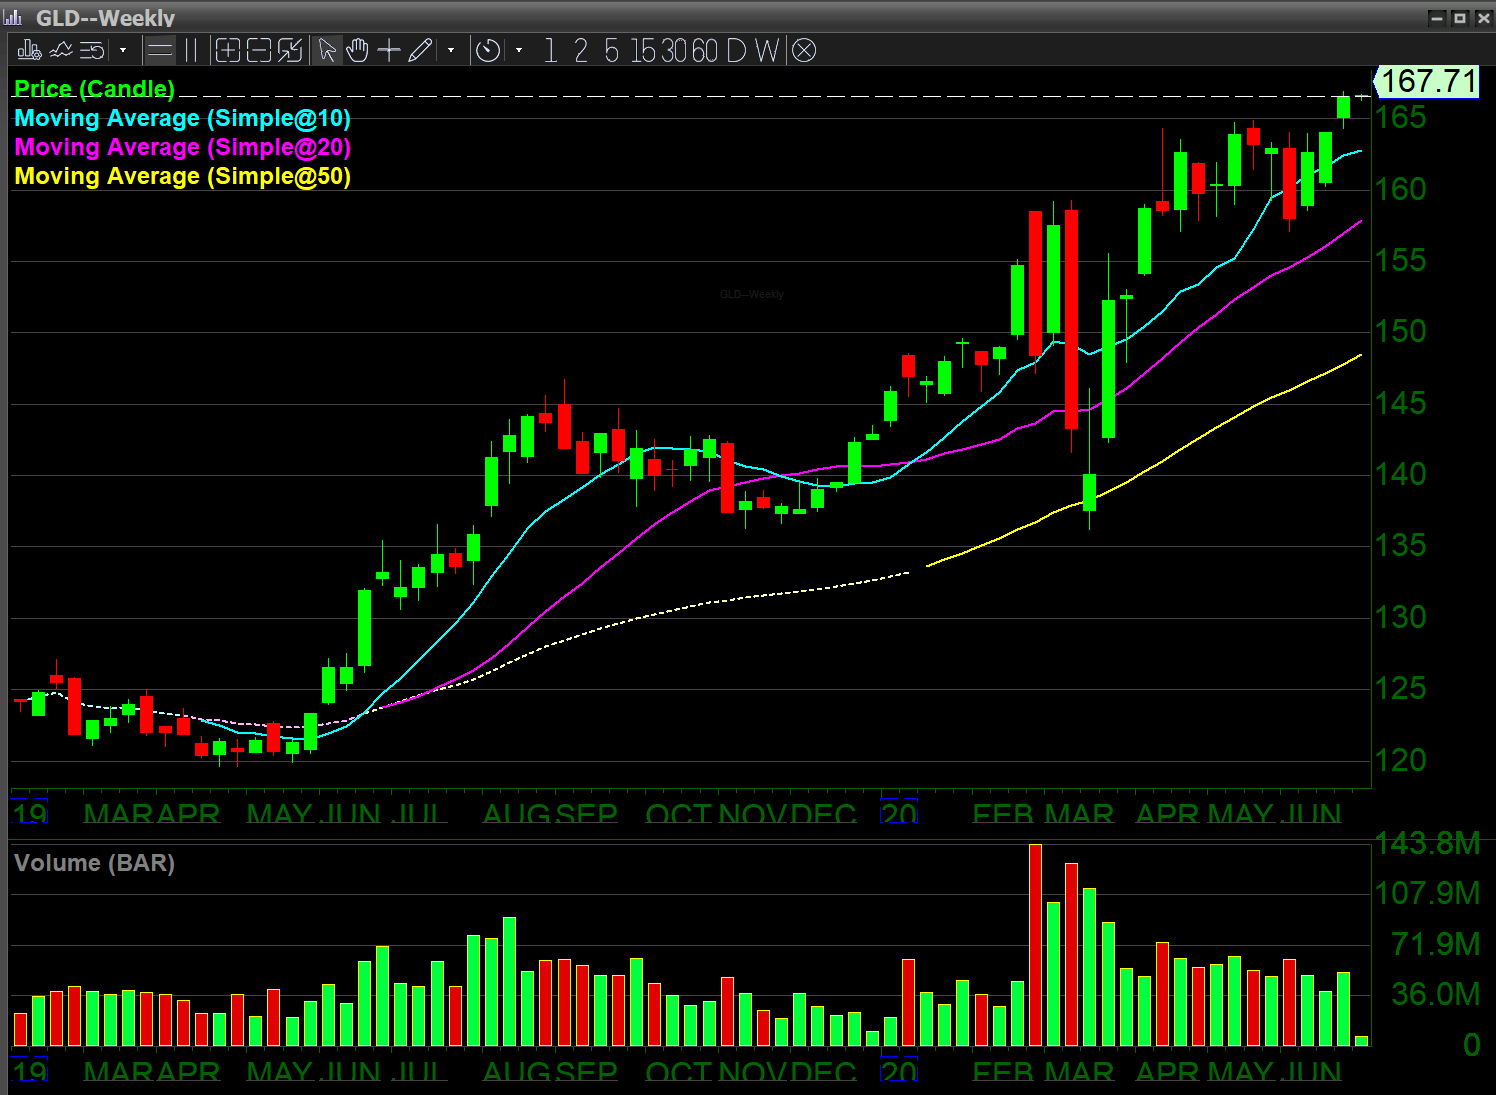
Gold ($GLD) continues to move higher and shows no signs of stopping until it retests its highs. The U.S. Federal Reserve and the European Central Bank continue to print money by way of new debt with reckless abandonment. The daily and weekly charts of $GLD ETF (Electronic Traded Fund) show strong indications of strength as it consolidates at the highs. Take a look at the weekly and 1 day charts below.

Opinion
We would lean in the direction of a bearish market, which means that we should expect sharp moves down and up, but with an overall direction back to the downside. Most of the moves seem to be occurring in the overnight session. Continued uncertainty, related to the Trump/Biden election combined with continued uncertainty around the Covid-19 pandemic and related reopenings will start to drag on the markets.
We will continue to lean in the direction of caution, meaning looking for strong stocks. This is a stock pickers market. We believe that you should sit on your hands when things do not make sense. For instance, the current surge in the market that we have seen the last few months seems to be a bull trap. Institutions are looking to sell baskets of equities of their excess supply to the retail “Robinhood” type investor while preparing to unload every ounce of stock they can at a 20% higher price than they could have at the lows. They will then buy it back 40% cheaper after the next negative news cycle when the focus is on unemployment, the damages to the supply cycle, and real estate defaults.
Keep in mind that markets very rarely bottom. They usually double bottom and base before a true reversal or resumption of a trend. We are still in wave one, and have nowhere near seen the full damage and effects of this pandemic to the economy. As far as the nation’s economy goes, it is still currently on life-support provided by the Federal Reserve and it may be so for the foreseeable future. The big questions are how the market will deal with the impending election and possible ongoing problems with China.
Covid-19Update
In the US, the current epicenters are California, Arizona, Texas, Florida, Georgia, as well as, North and South Carolina. Almost half of the southern states are showing signs of increases. However, this time around the death toll is much lower and the demographic tends to be much younger, as people in their 20s, 30s and 40s are getting sick because of lack of social distancing precautions.
Europe has largely reopened. Social distancing is the order of the day. We have yet to see any significant new increase in Europe as the social distancing measures were much more stringent than in the US.
As anticipated, Brazil, Mexico and India are very high on the new cases and death toll lists. Pretty much all of South America seems to be afflicted at the moment.
Trade Hypothesis
As expected, the market sold off rapidly with the onset of a global pandemic. After the initial sell off, the market rallied once protective measures and stimulus bills were passed. The financial markets seem to be reacting as a place to store value while this worldwide pandemic passes. The normal rules that govern the financial markets do not seem to apply at the moment as the markets seem to struggle off any negative news related to unemployment and prolonged problems caused by the pandemic. The big question is, whether these normal market fears will start to kick in.
Best of luck to you all. This is not investment advice by any means just an outlook of things that might come to be. Trade Well, Stay Safe.
