Bearish Fibonacci retracement techniques work just like bullish Fibonacci retracements, but they need to be flipped upside down. There are a few things to remember when applying any trading techniques to the short side. First, stocks go down faster than they go up because fear is a more powerful emotion than greed. Fibonacci bearish retracements will lead to a short spike to the upside. The moves up will most likely be quick and violent. Just like in the bullish direction, the key retracement numbers are 23.6% off the low, 38.2% off the low and 50%.
 Note: The Fibonacci numbers in the image above are rounded to the nearest decade number. I.e. 38.2% becomes 40%.
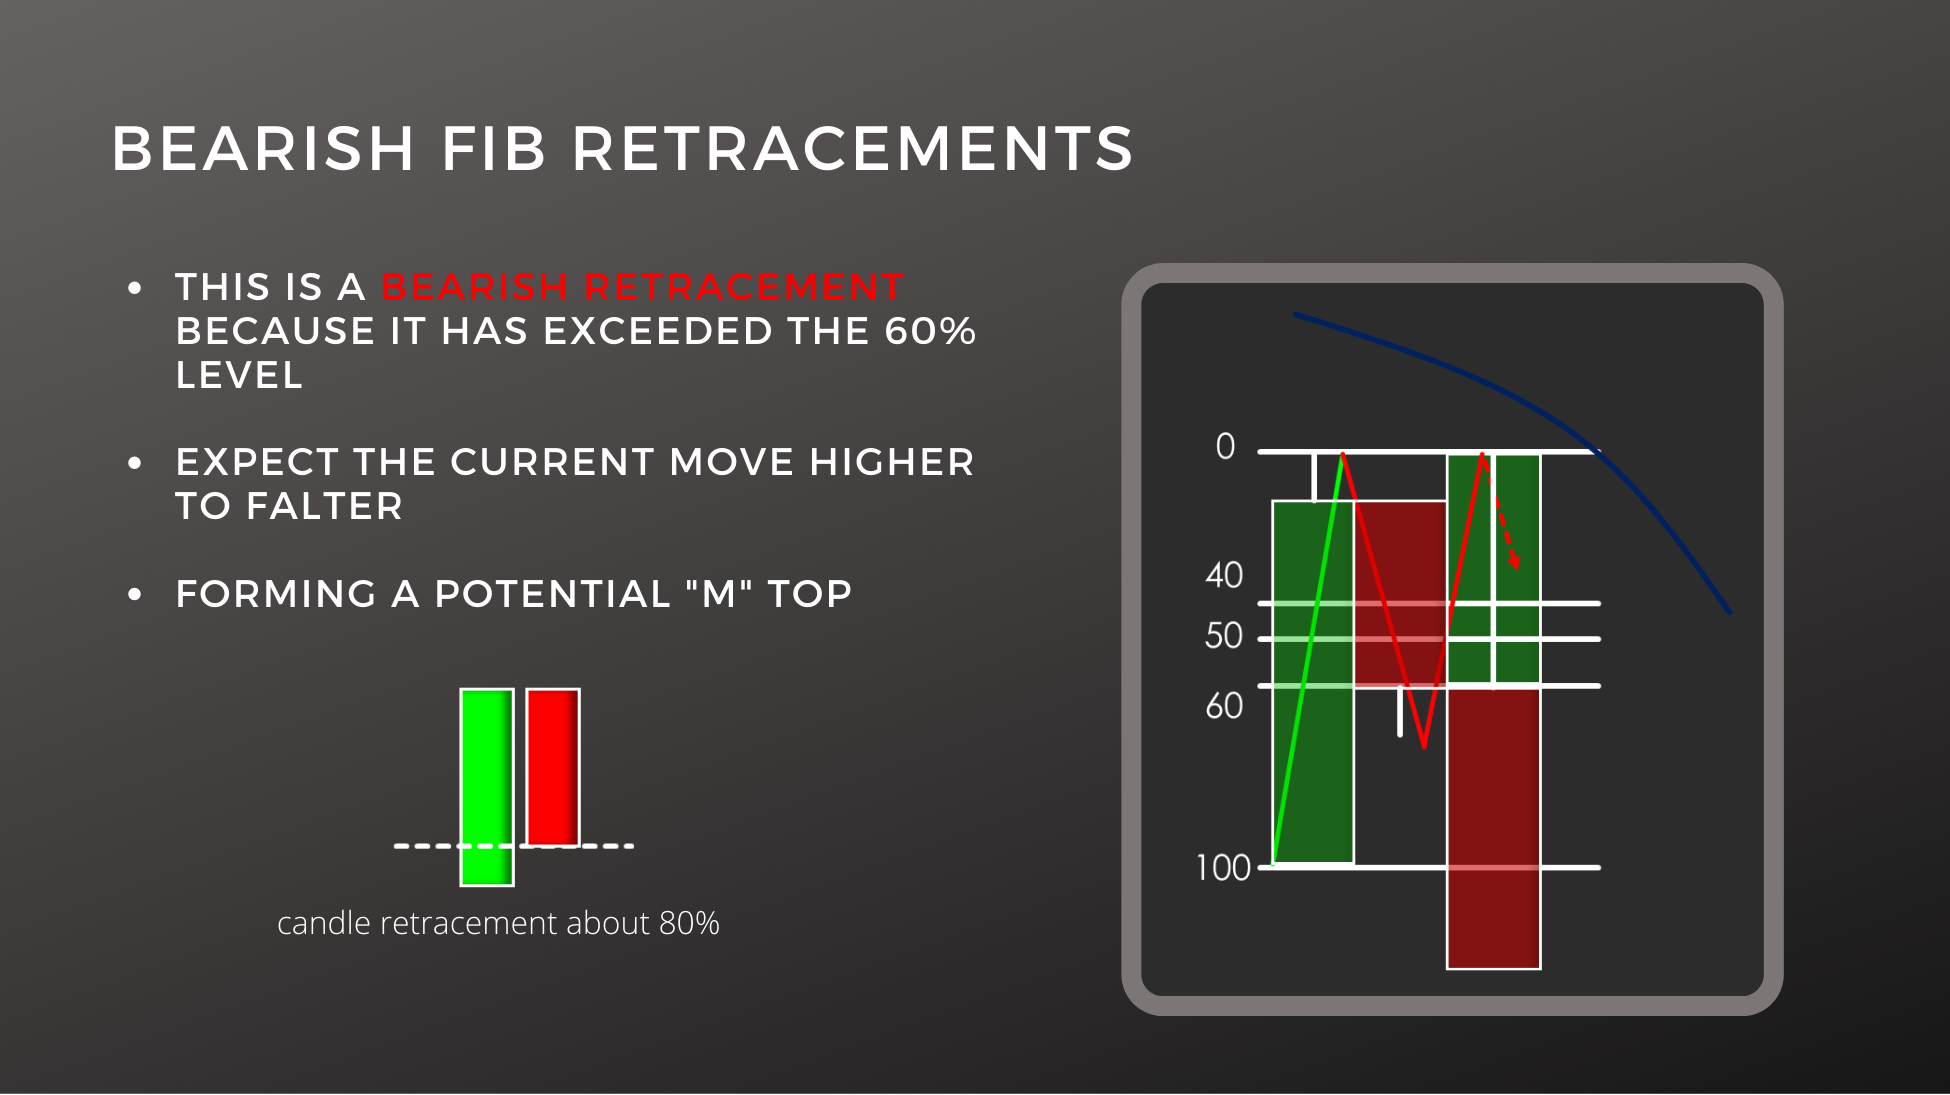
Let’s begin with the most bearish retracement which has exceeded the 60% level. We would also expect the current move higher to falter (as seen in the example above) forming a potential ‘M’ shaped top. Also be mindful of indicators like declining moving averages, which are important trend following tools. Keep in mind that it is sometimes easier to eyeball the chart and remember that retracement‘s are sometimes hard to see while using candlesticks versus line charts.

The 50% retracement is not a true Fibonacci ratio number, but the golden ratio uses 50% to generate all of the other numbers within the golden ratio. Therefore, traders use it as an important trading retracement level.
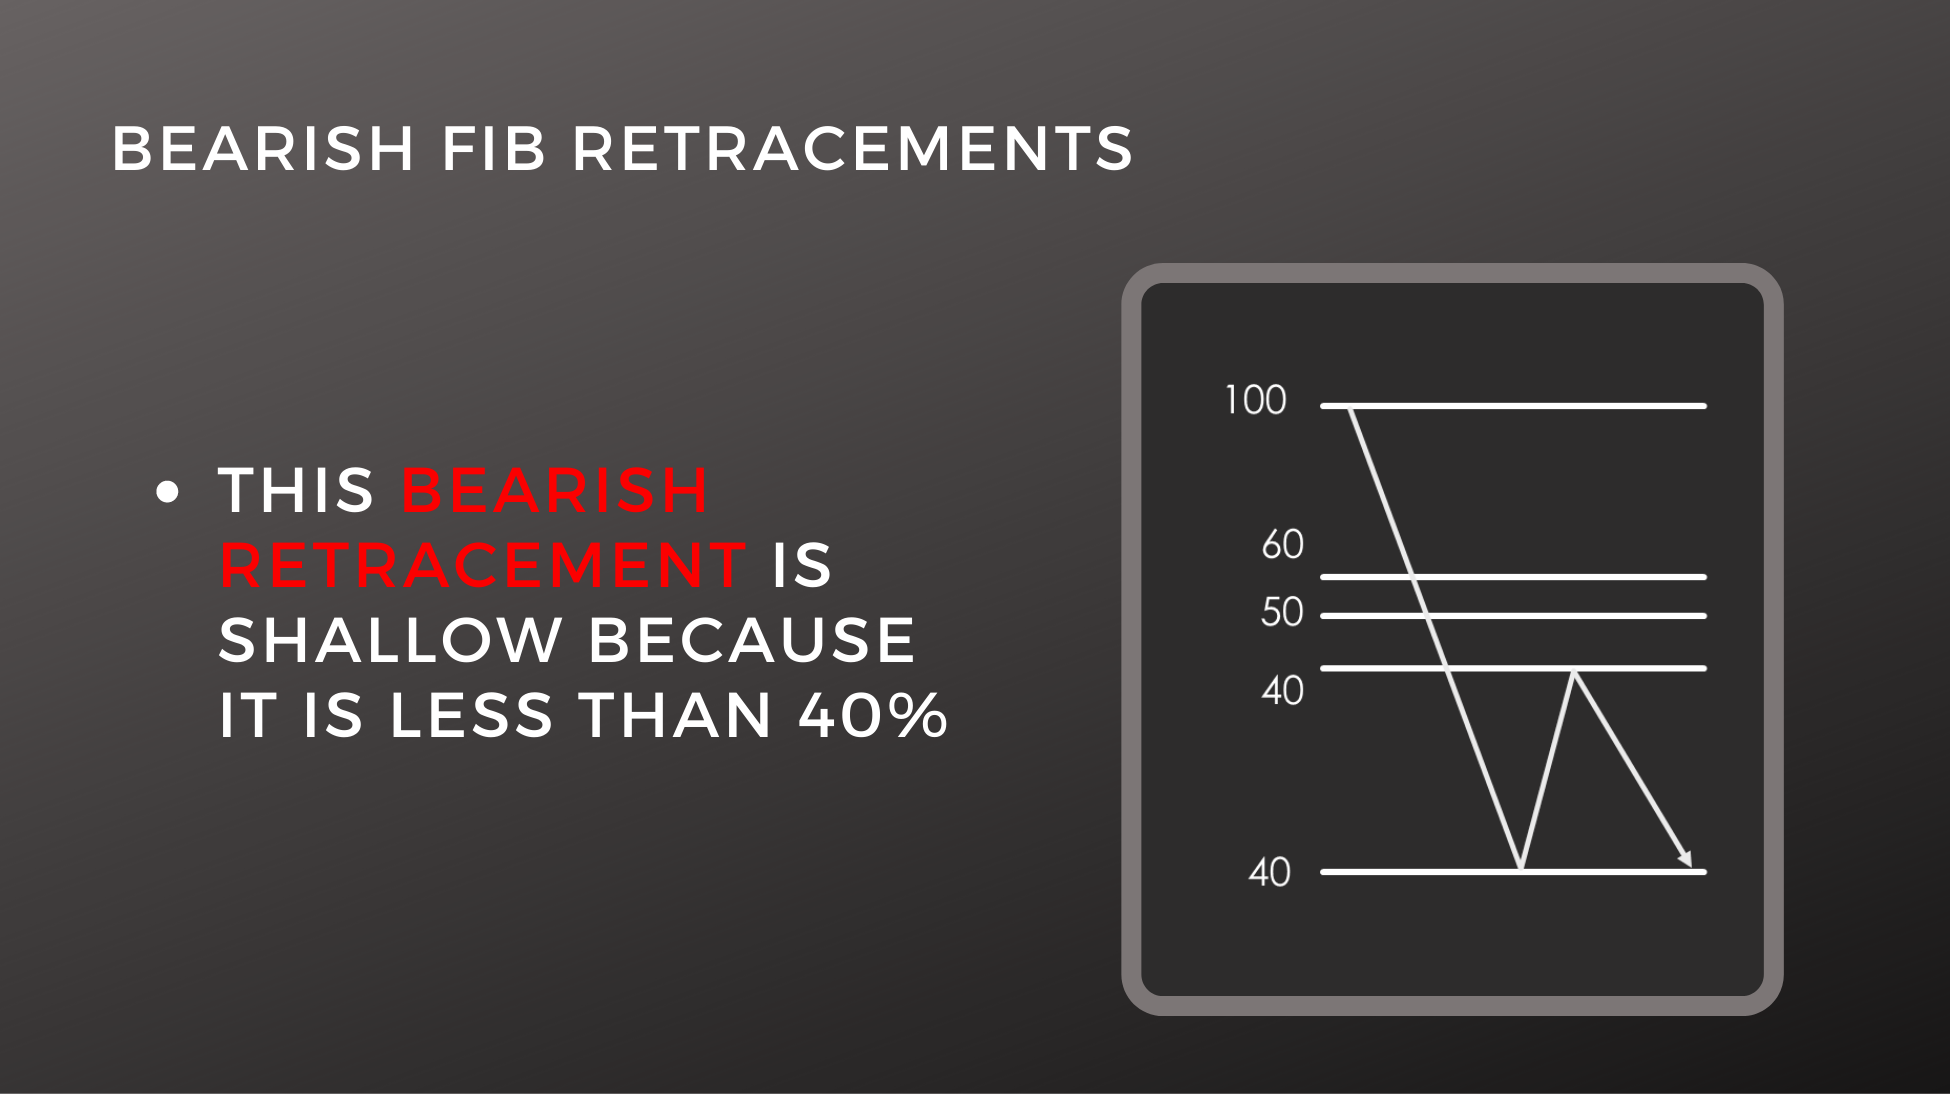
The least bearish retracement is a shallow 40% retracement which we use interchangeably with the 38.2% retracement level. This level means the stock could not rise more than 40% off its lows before it turned back to the downside. Think about this from the perspective of traders who own shares. After the stock started going down, they saw the stock started to rise but they were so nervous they didn’t let the stock rise 40% off its lows before starting to sell the stock.
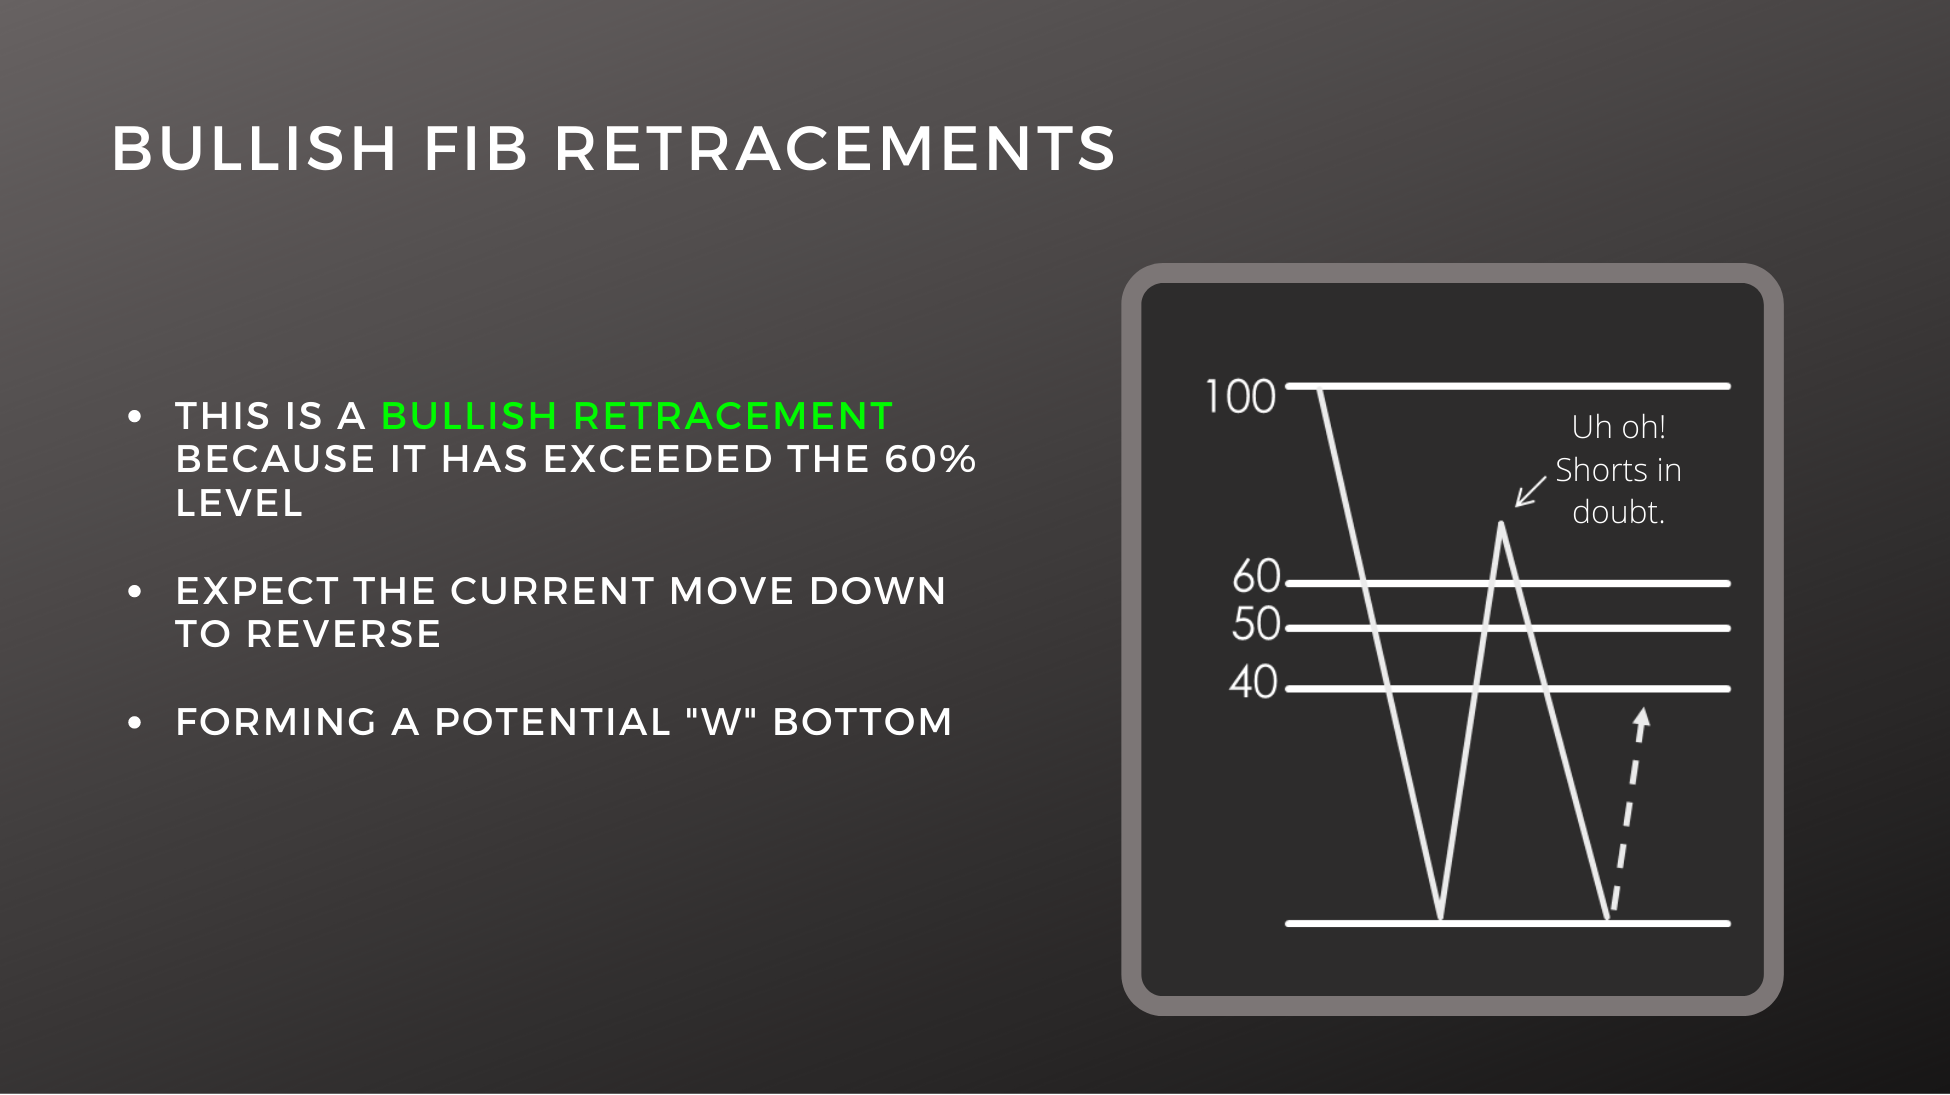
Any move on a stock that is greater than 60% is no longer considered a bearish retracement. We no longer expect the stock to break down to a new low; we expect support to hold. That means that we expect a ‘W’ shaped bottom to form as shown in the example above. A ‘W’ shaped bottom is a form of major support once it is formed. Using this retracement technique can help you see the creation of a major support level before it is actually completed.
Trade well.
Written by Michael DiGioia, Director of Education
Mike is available for One-on-One Coaching. Learn More